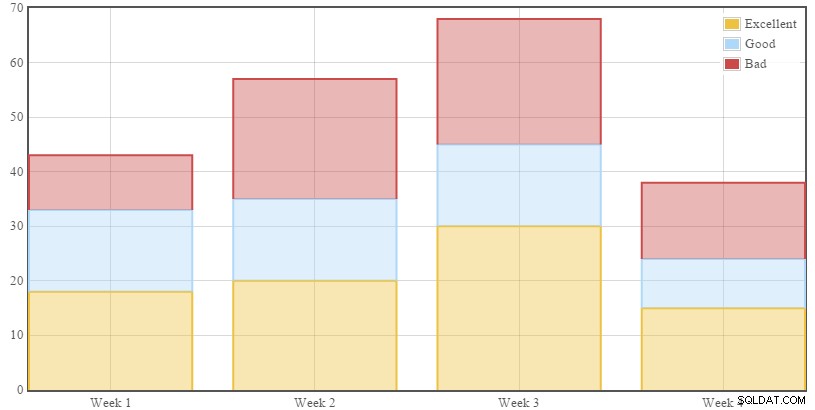
weeks /textual
を追加するには 列の下のデータは、ライブラリのカテゴリファイルjquery.flot.categories.min.jsを追加する必要があります javascriptアセットに。
私があなたを正しく理解しているなら、あなたはチャートをこのように見せたいでしょう

Javascript
これらのファイルを追加する必要があります
<script src="//ajax.googleapis.com/ajax/libs/jquery/1.11.1/jquery.min.js"></script>
<script src="jquery.flot.min.js"></script>
<script src="jquery.flot.categories.min.js"></script>
<script src="jquery.flot.stack.min.js"></script>
$outputについて説明するライブラリを初期化します。 このコードの後
<div id="placeholder" style="width:818px;height:413px" ></div>
<script type="text/javascript">
$(function() {
    var series = [<?php echo $output; ?>];
       $.plot("#placeholder", series, {
        series: {
            stack:true,
            lines:{fill:true,show:false,steps:false},
            bars: {
                show: true,
                barWidth: 0.8,
                align: "middle",
            },
        },
        xaxis: {
            mode: "categories",
            minTickSize: 1
        }
       });
});
PHP
まず、データベースにクエリを実行して、指定した日付の間の日付を見つける必要があります。結果を取得した後、各週のデータを配列で並べ替える必要があります
たとえば、week One => 'good','good','bad','bad', 'week two' => and so on ...
その後、 array_count_values()を使用できます。
発生数をカウントし、チャート列を作成します。
functionsを使用してコードを簡略化しました 簡単にするために
<?php
$con = mysqli_connect("localhost", 'root','','your db');

function getChartData($con, $startDate, $endDate){

    $startDate = date("Y-m-d H:i:s", strtotime($startDate));
    $endDate = date("Y-m-d H:i:s", strtotime($endDate));

    $query = "SELECT * FROM `employees` WHERE `date` BETWEEN '$startDate' AND '$endDate'";

    $result = mysqli_query($con, $query) or die ("Error: ".mysqli_error($con));

    // a multidimenional array containing each week with it's
    $weeksData = [];

    // Group each week with it's data
    while($row = mysqli_fetch_array($result)){
        $weekNumber = date("W", strtotime($row['date']));
        if(isset($weeksData[$weekNumber]))
        {
            $weeksData[$weekNumber][] = $row['level'];
        }
        $weeksData[$weekNumber][] = $row['level'];
    }

    // reset array indexes and sort the array
    sort($weeksData);

    $data = array();

    // using array_count_values to count the number of (good, bad and excellent)
    foreach ($weeksData as $key => $week) {
        $data[$key] = array_count_values($week);
    }

    // return all the weeks with number of (good, bad and excellent) occurences
    return $data;
}

// build the javascript object {data:['week num', occuerences]}
function buildColumn($data,$label, $numberOfWeeks)
{
    $data = array_column($data,strtolower($label));
    $balance = $numberOfWeeks - count($data);
    if($balance !=0){
        for($i=1;$i<=$balance;$i++) {
            $data[] = 1;
        }
    }

    $string = '{data: [';
    foreach ($data as $key => $value) {
        $weekNumber = $key+1;
        $string .= '["Week '.$weekNumber.'",'.$value.'],';
    }
    $string = rtrim($string, ',');
    $string .= "],valueLabels: {show: true,valign: 'middle'},label: '$label'}";
    return $string;
}

function getNumberofWeeks($startDate, $endDate){
      $weeks = array();
      $period = new DatePeriod(new DateTime($startDate),
        DateInterval::createFromDateString('+1 day'),new DateTime($endDate)
      );
      foreach ( $period as $dt ) {
        $weeks[] = $dt->format( 'W' );
      }
      return count(array_unique($weeks));
}
これで、これらの関数を次のように簡単に使用できます
$numberOfWeeks = getNumberofWeeks($_POST['start'],$_POST['end']);

// get data of the last number of weeks
$chartData = getChartData($con, $_POST['start'],$_POST['end']);
// bulding columns data for each occurence
$badColumn = buildColumn($chartData,'Bad', $numberOfWeeks);
$goodColumn = buildColumn($chartData,'Good', $numberOfWeeks);
$excellentColumn = buildColumn($chartData,'Excellent', $numberOfWeeks);

// output {data: ...}, {data: ...},{data:....}
$output = "$excellentColumn , $goodColumn , $badColumn";
完全な実例
<!DOCTYPE html>
<html>
<head>
    <title></title>
    <script src="//ajax.googleapis.com/ajax/libs/jquery/1.11.1/jquery.min.js"></script>
    <script src="jquery.flot.min.js"></script>
    <script src="jquery.flot.categories.min.js"></script>
    <script src="jquery.flot.stack.min.js"></script>
</head>
<body>
<?php
$con = mysqli_connect("localhost", 'root','','your db');

function getChartData($con, $startDate, $endDate){

    $startDate = date("Y-m-d H:i:s", strtotime($startDate));
    $endDate = date("Y-m-d H:i:s", strtotime($endDate));

    $query = "SELECT * FROM `employees` WHERE `date` BETWEEN '$startDate' AND '$endDate'";

    $result = mysqli_query($con, $query) or die ("Error: ".mysqli_error($con));

    // a multidimenional array containing each week with it's
    $weeksData = [];

    // Group each week with it's data
    while($row = mysqli_fetch_array($result)){
        $weekNumber = date("W", strtotime($row['date']));
        if(isset($weeksData[$weekNumber]))
        {
            $weeksData[$weekNumber][] = $row['level'];
        }
        $weeksData[$weekNumber][] = $row['level'];
    }

    // reset array indexes and sort the array
    sort($weeksData);

    $data = array();

    // using array_count_values to count the number of (good, bad and excellent)
    foreach ($weeksData as $key => $week) {
        $data[$key] = array_count_values($week);
    }

    // return all the weeks with number of (good, bad and excellent) occurences
    return $data;
}

// build the javascript object {data:['week num', occuerences]}
function buildColumn($data,$label, $numberOfWeeks)
{
    $data = array_column($data,strtolower($label));
    $balance = $numberOfWeeks - count($data);
    if($balance !=0){
        for($i=1;$i<=$balance;$i++) {
            $data[] = 1;
        }
    }

    $string = '{data: [';
    foreach ($data as $key => $value) {
        $weekNumber = $key+1;
        $string .= '["Week '.$weekNumber.'",'.$value.'],';
    }
    $string = rtrim($string, ',');
    $string .= "],valueLabels: {show: true,valign: 'middle'},label: '$label'}";
    return $string;
}

function getNumberofWeeks($startDate, $endDate){
      $weeks = array();
      $period = new DatePeriod(new DateTime($startDate),
        DateInterval::createFromDateString('+1 day'),new DateTime($endDate)
      );
      foreach ( $period as $dt ) {
        $weeks[] = $dt->format( 'W' );
      }
      return count(array_unique($weeks));
}
// the number of weeks that you want to display in the chart
$numberOfWeeks = getNumberofWeeks($_POST['start'],$_POST['end']);

// get data of the last number of weeks
$chartData = getChartData($con, $_POST['start'],$_POST['end']);
// bulding columns data for each occurence
$badColumn = buildColumn($chartData,'Bad', $numberOfWeeks);
$goodColumn = buildColumn($chartData,'Good', $numberOfWeeks);
$excellentColumn = buildColumn($chartData,'Excellent', $numberOfWeeks);

// output {data: ...}, {data: ...},{data:....}
$output = "$excellentColumn , $goodColumn , $badColumn";

?>
<div id="placeholder" style="width:818px;height:413px" ></div>
<script type="text/javascript">
$(function() {
    var series = [<?php echo $output; ?>];
       $.plot("#placeholder", series, {
        series: {
            stack:true,
            lines:{fill:true,show:false,steps:false},
            bars: {
                show: true,
                barWidth: 0.8,
                align: "middle",
            },
        },
        xaxis: {
            mode: "categories",
            minTickSize: 1
        }
       });
});
  </script>
 </body>
</html>
編集
これらの2つの関数を置き換えるだけで、dd/mm/yyyyと互換性があります。
 function getChartData($con, $startDate, $endDate){
    $startDate = explode('/', $startDate);
    $startDate = $startDate[1] . '/' . $startDate[0] . '/' . $startDate[2];

    $endDate = explode('/', $endDate);
    $endDate = $endDate[1] . '/' . $endDate[0] . '/' . $endDate[2];

    $startDate = date("Y-m-d H:i:s", strtotime($startDate));
    $endDate = date("Y-m-d H:i:s", strtotime($endDate));

    $query = "SELECT * FROM `employees` WHERE `date` BETWEEN '$startDate' AND '$endDate'";

    $result = mysqli_query($con, $query) or die ("Error: ".mysqli_error($con));

    // a multidimenional array containing each week with it's
    $weeksData = [];

    // Group each week with it's data
    while($row = mysqli_fetch_array($result)){
        $weekNumber = date("W", strtotime($row['date']));
        if(isset($weeksData[$weekNumber]))
        {
            $weeksData[$weekNumber][] = $row['level'];
        }
        $weeksData[$weekNumber][] = $row['level'];
    }

    // reset array indexes and sort the array
    sort($weeksData);

    $data = array();

    // using array_count_values to count the number of (good, bad and excellent)
    foreach ($weeksData as $key => $week) {
        $data[$key] = array_count_values($week);
    }

    // return all the weeks with number of (good, bad and excellent) occurences
    return $data;
}
および
   function getNumberofWeeks($startDate, $endDate){
    $startDate = explode('/', $startDate);
    $startDate = $startDate[1] . '/' . $startDate[0] . '/' . $startDate[2];

    $endDate = explode('/', $endDate);
    $endDate = $endDate[1] . '/' . $endDate[0] . '/' . $endDate[2];
    $diff = strtotime($startDate, 0) - strtotime($endDate, 0);

    return str_replace('-','', (int)floor($diff / 604800));
}
