
これは、シリーズの4番目で最後のパートです。マネージドPostgreSQLCloudソリューションのベンチマーク 。この記事の執筆時点では、Microsoft Azure PostgreSQLはバージョン10.7であり、バージョン10.6のAmazonAuroraPostgreSQLとバージョン9.6のGoogleCloudSQLforPostgreSQLの2つの競合製品よりも新しいものでした。
Microsoftは、WindowsでAzure PostgreSQLを実行することを決定しました:
postgres=> select version();
                        version
------------------------------------------------------------
PostgreSQL 10.7, compiled by Visual C++ build 1800, 64-bit
(1 row)
あまりうまく機能しなかったこの特定のテストでは、Microsoftが制限を十分に認識していると推測するのは危険です。これは、PostgreSQLの傘下でCitusDataバージョンのPostgreSQLのプレビューバージョンも提供している理由です。このアプローチは、AWS PostgreSQLフレーバー、RDS、およびそれぞれAuroraに似ています。
ちなみに、Azureアカウントを設定しているときに、AmazonのAWSVirtualMFAとGoogleの2段階認証で認められた2FA/MFA(Two-Factor / Multi-Factor)認証がないことに驚かされました。 Microsoftは、ActiveDirectoryまたはOffice365にサブスクライブしている企業顧客にのみMFAを提供しています。CitusCloudは本番データベースに2FAを適用しているため、おそらくMicrosoftはAzureに2FAを実装することからそれほど遠くありません。
TL; DR
Azureの結果はありません。 AWSおよびGCloudで使用されているものと同じコア数の8コアデータベースインスタンスでは、データベースエラーのためにテストを完了できませんでした。 16コアのインスタンスでは、pgbenchは完了し、sysbenchは最初の3つのテーブルを作成するところまで到達し、その時点でプロセスを中断しました。テストの実行とエラーとその原因の文書化にかなりの労力、時間、お金を費やすことをいとわなかったのですが、この演習の目標はベンチマークを実行することでした。したがって、高度なトラブルシューティングを行ったり、連絡したりすることを考えたことはありませんでした。 Azureのサポートも、16コアデータベースでのsysbenchテストも終了しませんでした。
クラウドインスタンス
クライアント
このブログシリーズの冒頭で選択したAWSインスタンスに最も近いAzureクライアントインスタンスは、次の仕様のE32sv3インスタンスでした。
- vCPU:32(16コアx 2スレッド/コア)
- RAM:256 GiB
- ストレージ:Azure Premium SSD
- ネットワーク:最大30Gbpsの高速ネットワーク
インスタンスの詳細が記載されたポータルのスクリーンショットは次のとおりです。
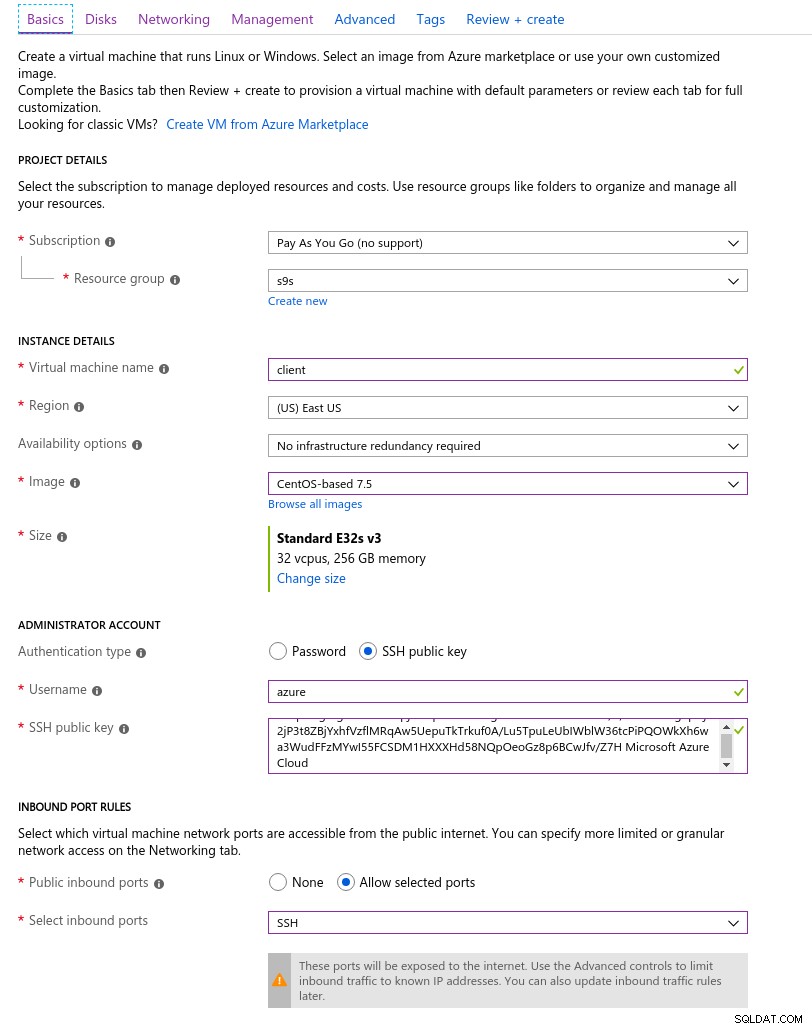 クライアントインスタンスの詳細
 サポートされている仮想マシンのいずれかを選択すると、デフォルトでアクセラレーテッドネットワーキングが有効になります。
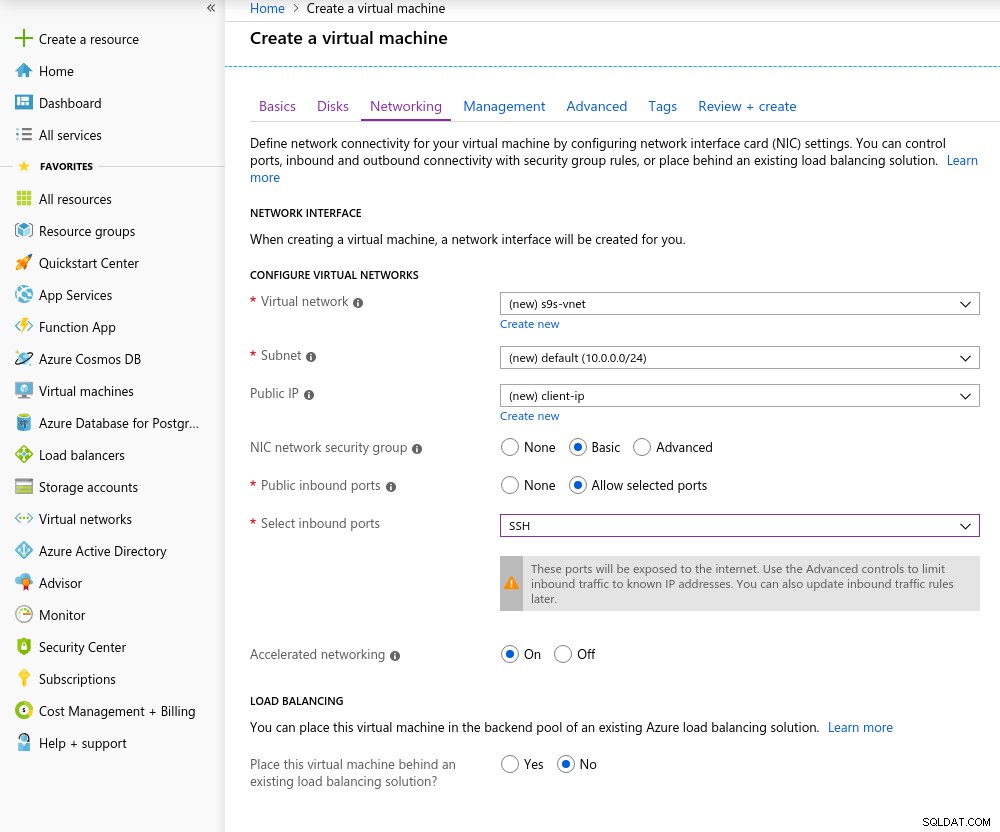 高速ネットワーキングオン
 クラウドのルールであるため、最高のネットワークパフォーマンスを実現するには、クライアントとサーバーを同じアベイラビリティーゾーンに配置する必要があります。これは、米国アリゾナ州東部に環境を設定することで行いました。
Google Cloudと同様に、10コアを超えるインスタンスではクォータの増加をリクエストする必要があります。マイクロソフトはそれを本当に簡単にしました。有料アカウントに切り替えると、承認の確認を受け取った後、チケットで返信を終えて、増加をリクエストする理由を説明しました。
データベース
インスタンスサイズを選択する際に、AWSとGoogle Cloudで使用されるインスタンスの仕様を一致させてみました:
- vCPU:8
- RAM:80 GiB(最大)
- ストレージ:6000 IOPS(3 IOPS / GBで2TiBサイズ)
- ネットワーク:2,000MB/秒
メモリサイズが小さいのは、メモリの割り当てに使用されるvCoreごとのメモリの式に起因します。
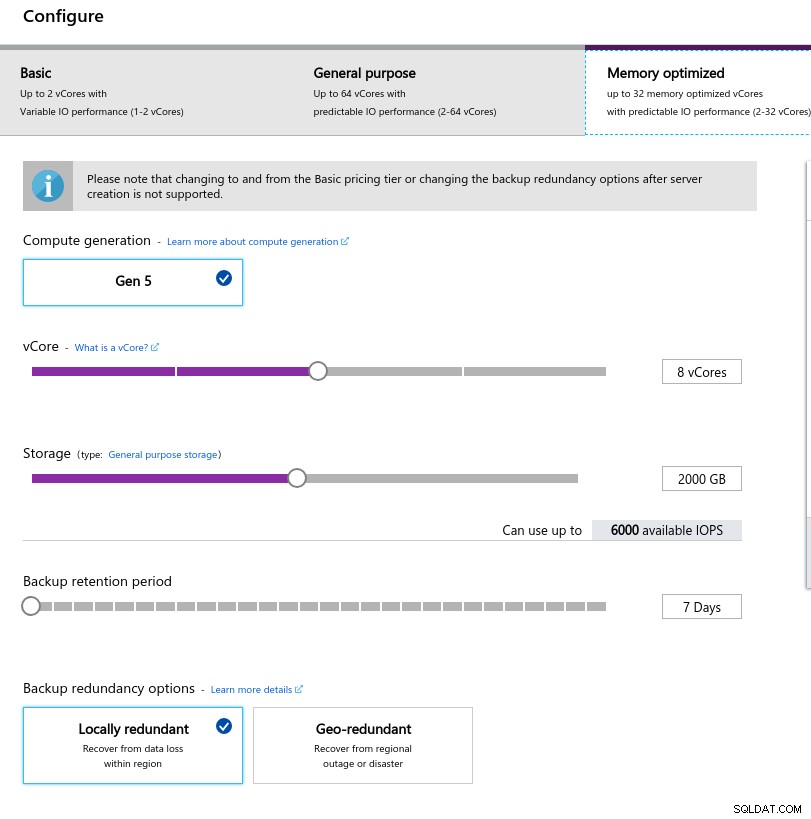 データベースインスタンスの構成
 Google Cloudと同様に、AWSとは異なり、ストレージが大きいほどIOPSが高くなり、比率が3:1増加しますが、サイズが2TiBに達すると、IOPSの上限は6000IOPSになります。
ベンチマークの実行
セットアップ
セットアップは、ブログシリーズの前の部分で説明したプロセスに従い、11.1のAWSpgbenchタイミングパッチをAzurePostgreSQLバージョン10.7にクリーンに適用しました。パッチは、PostgreSQLGithubリポジトリへのAWSLabsの投稿からも入手できます。
ベンチマークを実行する過程で、Amazonガイドに準拠した次のスクリプトを使用しました。この場合は、Azure(10.7)のPostgreSQLバージョンに合わせて調整されています。クライアントマシンはCentOS7.5を実行します:
#!/bin/bash

set -eE
trap "exit 1" ERR

yum -y install \
   wget ant git php gnuplot gcc make readline-devel zlib-devel \
   postgresql-jdbc bzr automake libtool patch libevent-devel \
   openssl-devel ncurses-devel

wget https://ftp.postgresql.org/pub/source/v10.7/postgresql-10.7.tar.gz
rm -rf postgresql-10.7
tar -xzf postgresql-10.7.tar.gz
cd postgresql-10.7
wget https://s3.amazonaws.com/aurora-pgbench-patches/pgbench-init-timing.patch
patch --verbose -p1 -b  < pgbench-init-timing.patch
./configure
make -j 4 all
make install
cd ..

rm -rf sysbench
git clone -b 0.5 https://github.com/akopytov/sysbench.git
cd sysbench
./autogen.sh
CFLAGS="-L/usr/local/pgsql/lib/ -I /usr/local/pgsql/include/" \
   | ./configure \
      --with-pgsql \
      --without-mysql \
      --with-pgsql-includes=/usr/local/pgsql/include/ \
      --with-pgsql-libs=/usr/local/pgsql/lib/
make
make install
cd sysbench/tests
make install

sed -i \
   '/^export PGHOST=/,/^export LD_LIBRARY_PATH.*pgsql/d' \
   ~/.bashrc
cat << "__eot__" >> ~/.bashrc
export PGHOST=CHANGEME
export PGUSER=postgres
export PGPASSWORD=postgres
export PGDATABASE=postgres
export PGPORT=5432
export PATH=/usr/local/pgsql/bin:/usr/local/bin:$PATH
export LD_LIBRARY_PATH=$LD_LIBRARY_PATH:/usr/local/pgsql/lib
__eot__

echo "All done."
スクリプトが完了したら、.bashrcを編集してPostgreSQL環境変数を設定します。 Azureは、ユビキタスな{username}ではなく{username} @ {host}の形式を期待することで、PostgreSQLユーザー名の形式に特有のものです。
[example@sqldat.com scripts]# psql
psql: FATAL:  Invalid Username specified. Please check the Username and retry connection. The Username should be in <example@sqldat.com> format.
テストを開始する前に、正しいバージョンのクライアントツールを使用していることを確認してください。
[example@sqldat.com scripts]# psql --version
psql (PostgreSQL) 10.7
[example@sqldat.com scripts]# pgbench --version
pgbench (PostgreSQL) 10.7[example@sqldat.com scripts]# sysbench --version
sysbench 0.5pgench
pgbenchデータベースを初期化します。
[example@sqldat.com ~]# pgbench -i --fillfactor=90 --scale=10000…そして数分後:
[example@sqldat.com scripts]# pgbench -i --fillfactor=90 --scale=10000
NOTICE:  table "pgbench_history" does not exist, skipping
NOTICE:  table "pgbench_tellers" does not exist, skipping
NOTICE:  table "pgbench_accounts" does not exist, skipping
NOTICE:  table "pgbench_branches" does not exist, skipping
creating tables...
100000 of 1000000000 tuples (0%) done (elapsed 0.04 s, remaining 426.44 s)
200000 of 1000000000 tuples (0%) done (elapsed 0.09 s, remaining 427.22 s)
300000 of 1000000000 tuples (0%) done (elapsed 0.18 s, remaining 600.63 s)
400000 of 1000000000 tuples (0%) done (elapsed 0.21 s, remaining 530.99 s)
500000 of 1000000000 tuples (0%) done (elapsed 0.30 s, remaining 595.12 s)

...

584300000 of 1000000000 tuples (58%) done (elapsed 2421.82 s, remaining 1723.01 s)
584400000 of 1000000000 tuples (58%) done (elapsed 2421.86 s, remaining 1722.32 s)
584500000 of 1000000000 tuples (58%) done (elapsed 2422.81 s, remaining 1722.29 s)
584600000 of 1000000000 tuples (58%) done (elapsed 2422.84 s, remaining 1721.60 s)
584700000 of 1000000000 tuples (58%) done (elapsed 2422.88 s, remaining 1720.92 s)
584800000 of 1000000000 tuples (58%) done (elapsed 2425.06 s, remaining 1721.76 s)
584900000 of 1000000000 tuples (58%) done (elapsed 2425.09 s, remaining 1721.07 s)
585000000 of 1000000000 tuples (58%) done (elapsed 2425.28 s, remaining 1720.50 s)
...

999700000 of 1000000000 tuples (99%) done (elapsed 4142.69 s, remaining 1.24 s)
999800000 of 1000000000 tuples (99%) done (elapsed 4142.95 s, remaining 0.83 s)
999900000 of 1000000000 tuples (99%) done (elapsed 4142.98 s, remaining 0.41 s)
1000000000 of 1000000000 tuples (100%) done (elapsed 4143.92 s, remaining 0.00 s)
vacuum...
set primary keys...
total time: 14805.73 s (insert 4146.94 s, commit 0.02 s, vacuum 6581.15 s, index 4077.61 s)
done.
これまでのところ、とても良いです。
データベースをざっと見て、準備ができていることを確認します。
example@sqldat.com:5432 postgres> \l+
                                                                                                List of databases
      Name        |      Owner      | Encoding |          Collate           |           Ctype            |          Access privileges          |   Size    | Table space |                Description
-------------------+-----------------+----------+----------------------------+----------------------------+-------------------------------------+-----------+------------+--------------------------------------------
azure_maintenance | azure_superuser | UTF8     | English_United States.1252 | English_United States.1252 | azure_superuser=CTc/azure_superuser | No Access | pg_default  |
azure_sys         | azure_superuser | UTF8     | English_United States.1252 | English_United States.1252 |                                     | 12 MB     | pg_default  |
postgres          | azure_superuser | UTF8     | English_United States.1252 | English_United States.1252 |                                     | 160 GB    | pg_default  | default administrative connection database
template0         | azure_superuser | UTF8     | English_United States.1252 | English_United States.1252 | =c/azure_superuser                 +| 7865 kB   | pg_default  | unmodifiable empty database
                  |                 |          |                            |                            | azure_superuser=CTc/azure_superuser |           |             |
template1         | azure_superuser | UTF8     | English_United States.1252 | English_United States.1252 | =c/azure_superuser                 +| 7865 kB   | pg_default  | default template for new databases
                  |                 |          |                            |                            | azure_superuser=CTc/azure_superuser |           |             |
(5 rows)
Azureではmax_connectionsの変更が許可されておらず、選択したインスタンスの制限が960に制限されているため、それに応じてpgbenchクライアントの数を調整する必要があります。
[example@sqldat.com scripts]# pgbench --protocol=prepared -P 60 --time=600 --client=950 --jobs=2048
starting vacuum...end.
connection to database "postgres" failed:
could not translate host name "postgresql-10-7.postgres.database.azure.com" to address: Name or service not known
connection to database "postgres" failed:
could not translate host name "postgresql-10-7.postgres.database.azure.com" to address: Name or service not known
そして、それが最初のしゃっくりです。
ホストのDNS解決を簡単にチェックしても、問題はありません:
[example@sqldat.com scripts]# dig +short $PGHOST
cr1.eastus1-a.control.database.windows.net.
191.238.6.43
[example@sqldat.com scripts]# cat /etc/resolv.conf
; generated by /usr/sbin/dhclient-script
search 11jv1qvdjs5utlhtlyb5vdyeth.bx.internal.cloudapp.net
nameserver 168.63.129.16スクリーンログを確認すると、接続のほぼ半分が終了したことがわかります。
~$ cat screenlog.1 | nl | grep 'could not translate host name "postgresql-10-7.*Name or service not known' | wc -l
469
pg_stat_activityは、より詳細なストーリーを伝えます—950の接続で急上昇します:
example@sqldat.com:5432 postgres> select now(), count(*) from pg_stat_activity where usename = 'postgres' and application_name = 'pgbench';                                now              | count
-------------------------------+-------
2019-05-03 23:39:18.200291+00 |   950
(1 row)
…ただし、上記のクエリを監視すると、接続数が950から628に、わずか10秒で突然減少することがわかります。
example@sqldat.com:5432 postgres> \watch 10
Fri 03 May 2019 11:41:05 PM UTC (every 10s)

            now              | count
-------------------------------+-------
2019-05-03 23:41:05.044025+00 |   950
(1 row)

...

Fri 03 May 2019 11:43:10 PM UTC (every 10s)

            now              | count
-------------------------------+-------
2019-05-03 23:43:10.512766+00 |   950
(1 row)

Fri 03 May 2019 11:43:20 PM UTC (every 10s)

            now              | count
-------------------------------+-------
2019-05-03 23:43:17.419011+00 |   628
(1 row)

Fri 03 May 2019 11:43:30 PM UTC (every 10s)

            now              | count
-------------------------------+-------
2019-05-03 23:43:31.434638+00 |   613
(1 row)
DNSの問題を回避するために、PGHOSTにホストIPアドレスを割り当てました:
[example@sqldat.com scripts]# set | grep PG
PGDATABASE=postgres
PGHOST=191.238.6.43
example@sqldat.com
PGPORT=5432
example@sqldat.com
その回避策を実行して、テストを再開しました:
[example@sqldat.com scripts]# pgbench --protocol=prepared -P 60 --time=600 --client=950 --jobs=2048
starting vacuum...end.
progress: 61.1 s, 457.7 tps, lat 559.138 ms stddev 1755.888
progress: 120.1 s, 78.8 tps, lat 3883.772 ms stddev 10551.545
progress: 180.1 s, 17.6 tps, lat 50831.708 ms stddev 31214.512
progress: 240.1 s, 15.2 tps, lat 42474.763 ms stddev 32702.050
progress: 300.1 s, 16.1 tps, lat 43584.559 ms stddev 29818.142
progress: 360.1 s, 26.5 tps, lat 36914.096 ms stddev 37152.588
progress: 420.0 s, 33.4 tps, lat 27542.926 ms stddev 37075.457
progress: 480.0 s, 20.2 tps, lat 47149.060 ms stddev 47087.474
progress: 540.0 s, 13.5 tps, lat 55609.260 ms stddev 60394.287
progress: 600.0 s, 36.5 tps, lat 49566.853 ms stddev 99155.598

transaction type: <builtin: TPC-B (sort of)>
scaling factor: 10000
query mode: prepared
number of clients: 950
number of threads: 950
duration: 600 s
number of transactions actually processed: 44293
latency average = 12493.888 ms
latency stddev = 40490.231 ms
tps = 60.907130 (including connections establishing)
tps = 64.213520 (excluding connections establishing)
一見、問題なく動作しているように見えますが、以前のDNSの問題と「高速ネットワーク」対応のクライアントと相まって、非常に高い遅延値は、ネットワークレベルで何かがおかしいことを示唆しています。低tpsの結果の原因。しかし、最悪の事態はまだ来ていません。
今日のホワイトペーパーをダウンロードするClusterControlを使用したPostgreSQLの管理と自動化PostgreSQLの導入、監視、管理、スケーリングを行うために知っておくべきことについて学ぶホワイトペーパーをダウンロードするsysbench
まず、テーブルを作成します:
sysbench --test=/usr/local/share/sysbench/oltp.lua \
--pgsql-host=${PGHOST} \
--pgsql-db=${PGDATABASE} \
--pgsql-user=${PGUSER} \
--pgsql-password=${PGPASSWORD} \
--pgsql-port=${PGPORT} \
--oltp-tables-count=250\
--oltp-table-size=450000 \
prepare
After a little while:
sysbench 0.5:  multi-threaded system evaluation benchmark

Creating table 'sbtest1'...
FATAL: PQexec() failed: 7 server closed the connection unexpectedly
        This probably means the server terminated abnormally
        before or while processing the request.

FATAL: failed query: CREATE TABLE sbtest1 (
id SERIAL NOT NULL,
k INTEGER DEFAULT '0' NOT NULL,
c CHAR(120) DEFAULT '' NOT NULL,
pad CHAR(60) DEFAULT '' NOT NULL,
PRIMARY KEY (id)
)
FATAL: failed to execute function `prepare': 3
まったく見栄えが良くなかったので、PostgreSQLのログを確認しました:
2019-05-03 23:51:12 UTC-5ccbbe4f.88-WARNING:  worker took too long to start; canceled
2019-05-03 23:51:14 UTC-5ccbbe4f.84-PANIC:  could not write to log file 000000010000001F000000CD at offset 13664256, length 8192: Invalid argument
+++ NT HARD ERROR (0xd0000144) +++
    Parameter 0: 0xffffffffc0000005
    Parameter 1: 0x1b80f0f73b
    Parameter 2: 0x1
    Parameter 3: 0x0
サービスは自然に回復するはずですが、プロセスを高速化するためにインスタンスを再起動することにしました。
2019-05-04 00:43:23 UTC-5ccce02a.2c-HINT:  Is another postmaster already running on port 20108? If not, wait a few seconds and retry.
2019-05-04 00:43:23 UTC-5ccce02a.2c-LOG:  could not bind IPv6 address "::": A socket operation was attempted to an unreachable host.
2019-05-04 00:43:23 UTC-5ccce02a.2c-LOG:  listening on IPv4 address "0.0.0.0", port 20108
2019-05-04 00:43:24 UTC-5ccce02a.2c-LOG:  database system is ready to accept connections
...
2019-05-05 00:03:35 UTC-5cce2856.2c-HINT:  Is another postmaster already running on port 20326? If not, wait a few seconds and retry.
2019-05-05 00:03:35 UTC-5cce2856.2c-LOG:  could not bind IPv6 address "::": A socket operation was attempted to an unreachable host.
2019-05-05 00:03:35 UTC-5cce2856.2c-LOG:  listening on IPv4 address "0.0.0.0", port 20326
2019-05-05 00:03:38 UTC-5cce285a.3c-FATAL:  the database system is starting up
2019-05-05 00:03:38 UTC-5cce285a.3c-LOG:  connection received: host=127.0.0.1 port=47247 pid=60
2019-05-05 00:03:49 UTC-5cce2865.40-FATAL:  the database system is starting up
2019-05-05 00:03:49 UTC-5cce2865.40-LOG:  connection received: host=127.0.0.1 port=47284 pid=64
2019-05-05 00:03:59 UTC-5cce286f.44-FATAL:  the database system is starting up
2019-05-05 00:03:59 UTC-5cce286f.44-LOG:  connection received: host=127.0.0.1 port=47312 pid=68
2019-05-05 00:04:00 UTC-5cce2856.2c-LOG:  database system is ready to accept connections
2019-05-05 00:04:00 UTC-5cce2870.38-LOG:  database system was shut down at 2019-05-05 00:03:34 UTC
この時点で、クエリパフォーマンスの洞察も有効にしました:
2019-05-05 00:04:13 UTC-5cce2856.2c-LOG:  parameter "pgms_wait_sampling.query_capture_mode" changed to "ALL"
2019-05-05 00:04:13 UTC-5cce2856.2c-LOG:  parameter "pg_qs.query_capture_mode" changed to "TOP"
2019-05-05 00:04:13 UTC-5cce2856.2c-LOG:  received SIGHUP, reloading configuration files
2019-05-05 00:04:13 UTC-5cce2856.2c-LOG:  received SIGHUP, reloading configuration files
2019-05-05 00:04:13 UTC-5cce287a.6c-ERROR:  database "azure_sys" already exists
2019-05-05 00:04:13 UTC-5cce287a.6c-STATEMENT:  CREATE DATABASE azure_sys TEMPLATE template0
sysbenchタスクを再開する前に、データベースが正常であることを確認したかったので、2番目のpgbenchテストを起動しました:
[example@sqldat.com scripts]# pgbench --protocol=prepared -P 60 --time=600 --client=950 --jobs=2048
starting vacuum...end.
connection to database "postgres" failed:
server closed the connection unexpectedly
        This probably means the server terminated abnormally
        before or while processing the request.
connection to database "postgres" failed:
server closed the connection unexpectedly
        This probably means the server terminated abnormally
        before or while processing the request.
connection to database "postgres" failed:
server closed the connection unexpectedly
        This probably means the server terminated abnormally
        before or while processing the request.
connection to database "postgres" failed:
server closed the connection unexpectedly
        This probably means the server terminated abnormally
        before or while processing the request.
pg_stat_activityクエリモニターによると、接続数が710に達したときにサーバーが停止しました:
example@sqldat.com:5432 postgres> \watch 1
Sun 05 May 2019 12:44:11 AM UTC (every 1s)

            now              | count
-------------------------------+-------
2019-05-05 00:44:11.010413+00 |   220
(1 row)

Sun 05 May 2019 12:44:12 AM UTC (every 1s)

            now              | count
-------------------------------+-------
2019-05-05 00:44:12.041667+00 |   231
(1 row)

...

            now              | count
------------------------------+-------
2019-05-05 00:47:33.16533+00 |   710
(1 row)

Sun 05 May 2019 12:47:40 AM UTC (every 1s)

            now              | count
-------------------------------+-------
2019-05-05 00:47:40.524662+00 |   710
(1 row)
そしてPostgreSQLログから、接続パイプに沿って何かが起こったことがわかります:
2019-05-05 00:44:11 UTC-5cce31da.c60-LOG:  connection received: host=40.114.85.62 port=50925 pid=3168
2019-05-05 00:44:11 UTC-5cce31db.c58-LOG:  connection received: host=40.114.85.62 port=55256 pid=3160
2019-05-05 00:44:11 UTC-5cce31db.c5c-LOG:  connection received: host=40.114.85.62 port=34526 pid=3164
2019-05-05 00:44:11 UTC-5cce31db.c64-LOG:  connection received: host=40.114.85.62 port=1178 pid=3172
...
2019-05-05 00:47:32 UTC-5cce329a.146c-LOG:  connection received: host=40.114.85.62 port=41769 pid=5228
2019-05-05 00:47:33 UTC-5cce3287.1404-LOG:  connection authorized: user=postgresdatabase=postgres SSL enabled (protocol=TLSv1.1, cipher=ECDHE-RSA-AES256-SHA, compression=off)
2019-05-05 00:47:33 UTC-5cce3288.1428-LOG:  connection authorized: user=postgresdatabase=postgres SSL enabled (protocol=TLSv1.1, cipher=ECDHE-RSA-AES256-SHA, compression=off)
2019-05-05 00:47:33 UTC-5cce3289.1434-LOG:  connection authorized: user=postgresdatabase=postgres SSL enabled (protocol=TLSv1.1, cipher=ECDHE-RSA-AES256-SHA, compression=off)
2019-05-05 00:47:33 UTC-5cce3291.1448-LOG:  connection authorized: user=postgresdatabase=postgres SSL enabled (protocol=TLSv1.1, cipher=ECDHE-RSA-AES256-SHA, compression=off)
2019-05-05 00:47:33 UTC-5cce32a3.1484-LOG:  connection received: host=40.114.85.62 port=50296 pid=5252
2019-05-05 00:47:33 UTC-5cce32a5.1488-LOG:  connection received: host=40.114.85.62 port=28304 pid=5256
2019-05-05 00:47:39 UTC-5cce31d2.a24-LOG:  could not send data to client: An existing connection was forcibly closed by the remote host.
2019-05-05 00:47:39 UTC-5cce31d5.ae8-LOG:  could not receive data from client: An existing connection was forcibly closed by the remote host.
2019-05-05 00:47:39 UTC-5cce31e3.ee4-LOG:  could not send data to client: An existing connection was forcibly closed by the remote host.
2019-05-05 00:47:39 UTC-5cce31e9.1054-LOG:  could not receive data from client: An existing connection was forcibly closed by the remote host.
2019-05-05 00:47:39 UTC-5cce3291.1444-LOG:  could not receive data from client: An existing connection was forcibly closed by the remote host.
2019-05-05 00:47:40 UTC-5cce31cd.8ec-LOG:  could not send data to client: An existing connection was forcibly closed by the remote host.
max_connectionsの制限と、pgbenchおよびsysbenchのテスト中に発生した問題に直面して、16コアデータベースが同じ動作を示すかどうかについて興味を持ち始めました。
16-コアデータベースインスタンス
16コアのデータベースインスタンスでは、max_connectionsの制限は1000クライアントを収容するのに十分な大きさです:
example@sqldat.com:5432 postgres> show max_connections ;
 max_connections
-----------------
 1900
(1 row)
これにより、以前のクラウドプロバイダーで使用したのと同じベンチマークコマンドを実行できました。
ベンチマークは正常に完了し、結果を以下に示します。
pgbench
- 初期化:
[example@sqldat.com scripts]# pgbench -i --fillfactor=90 --scale=10000 NOTICE: table "pgbench_history" does not exist, skipping NOTICE: table "pgbench_tellers" does not exist, skipping NOTICE: table "pgbench_accounts" does not exist, skipping NOTICE: table "pgbench_branches" does not exist, skipping creating tables... 100000 of 1000000000 tuples (0%) done (elapsed 0.08 s, remaining 807.39 s) 200000 of 1000000000 tuples (0%) done (elapsed 0.13 s, remaining 628.37 s) 300000 of 1000000000 tuples (0%) done (elapsed 0.16 s, remaining 527.89 s) ... 600100000 of 1000000000 tuples (60%) done (elapsed 2499.90 s, remaining 1665.90 s) 600200000 of 1000000000 tuples (60%) done (elapsed 2500.07 s, remaining 1665.33 s) ... 999900000 of 1000000000 tuples (99%) done (elapsed 4170.91 s, remaining 0.42 s) 1000000000 of 1000000000 tuples (100%) done (elapsed 4171.29 s, remaining 0.00 s) vacuum... set primary keys... total time: 13701.50 s (insert 4173.33 s, commit 0.05 s, vacuum 7098.74 s, index 2429.39 s) done. - 実行:
[example@sqldat.com scripts]# pgbench --protocol=prepared -P 60 --time=600 --client=1000 --jobs=2048
starting vacuum...end.
progress: 81.4 s, 5639.1 tps, lat 80.094 ms stddev 73.213
progress: 120.0 s, 4091.0 tps, lat 224.161 ms stddev 608.523
progress: 180.0 s, 6932.1 tps, lat 145.143 ms stddev 228.925
progress: 240.0 s, 7287.9 tps, lat 136.521 ms stddev 156.643
progress: 300.0 s, 7567.8 tps, lat 132.722 ms stddev 158.754
progress: 360.0 s, 8077.9 tps, lat 123.801 ms stddev 139.033
progress: 420.0 s, 6076.9 tps, lat 163.886 ms stddev 201.121
progress: 480.0 s, 5376.2 tps, lat 186.678 ms stddev 191.270
progress: 540.0 s, 4864.0 tps, lat 205.696 ms stddev 164.261
progress: 600.0 s, 3759.3 tps, lat 266.073 ms stddev 542.717
transaction type: <builtin: TPC-B (sort of)>
scaling factor: 10000
query mode: prepared
number of clients: 1000
number of threads: 1000
duration: 600 s
number of transactions actually processed: 3614386
latency average = 152.935 ms
latency stddev = 248.593 ms
tps = 6002.082008 (including connections establishing)
tps = 6513.306467 (excluding connections establishing)
これはかなりうまくいきましたが、同様のプラットフォームでテストしていないため、これらの結果をAWSやGCloudの結果と比較する有効な方法はありません。しかし、これは私たちを次のポイントに導くのに十分です。
sysbench
pgbenchテストが正常に完了したので、Azure $ 200クレジットを最大限に活用し、sysbenchが8コアインスタンスでの前回の実行よりも進んでいることを確認することにしました。
sysbench \
   --test=/usr/local/share/sysbench/oltp.lua \
   --pgsql-host=191.238.6.43 \
   --pgsql-db=postgres \
   example@sqldat.com \
   example@sqldat.com \
   --pgsql-port=5432 \
   --oltp-tables-count=250 \
   --oltp-table-size=450000 prepare

sysbench 0.5:  multi-threaded system evaluation benchmark

Creating table 'sbtest1'...
Inserting 450000 records into 'sbtest1'
Creating secondary indexes on 'sbtest1'...
Creating table 'sbtest2'...
Inserting 450000 records into 'sbtest2'
Creating secondary indexes on 'sbtest2'...
Creating table 'sbtest3'...
Inserting 450000 records into 'sbtest3'
Creating secondary indexes on 'sbtest3'...
Creating table 'sbtest4'...
それはうまく機能しているようで、予算に近づいていたので、タスクを停止することにしました。
ハイパースケール(Citus)
本番環境に対応していませんが、AWSやGクラウドでは利用できない高度な機能を提供するため、このオプションは検討に値します。
Citus Dataを買収した結果、MicrosoftはHyperscale(Citus)という名前で主力のPostgreSQL製品のプレビューバージョンを提供しています。
ポータルウィザードを使用すると、他の方法では複雑な環境を簡単にセットアップできます。
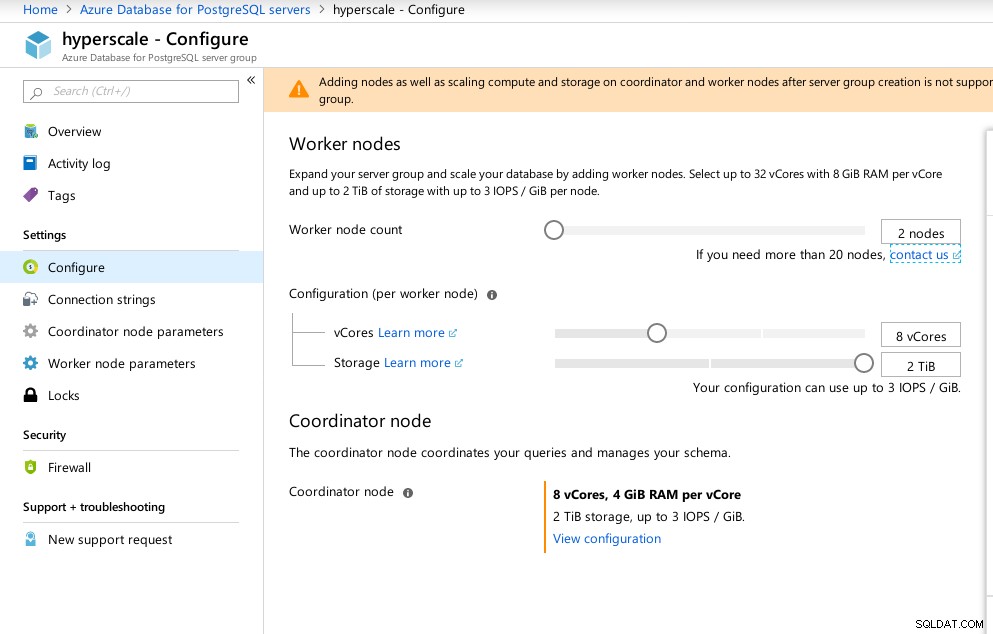 Azure Hyperscale(Citus)構成
 Windowsで実行されるAzurePostgreSQLとは対照的に、HyperscaleはLinuxで実行されることに注意しました。
example@sqldat.com:5432 citus> select version();
                                                    version
----------------------------------------------------------------------------------------------------------------
 PostgreSQL 11.2 on x86_64-pc-linux-gnu, compiled by gcc (Ubuntu 5.4.0-6ubuntu1~16.04.5) 5.4.0 20160609, 64-bit
(1 row)
残念ながら、Hyperscaleはエキサイティングな旅を約束していましたが、ネイティブのCitus PosgreSQLの機能は文書化されていますが、現時点ではmax_connectionsが現在300に制限されており、調整のオプションがないため、テストの実行を進めることができませんでした。
example@sqldat.com:5432 citus> show max_connections ;
max_connections
-----------------
300
(1 row)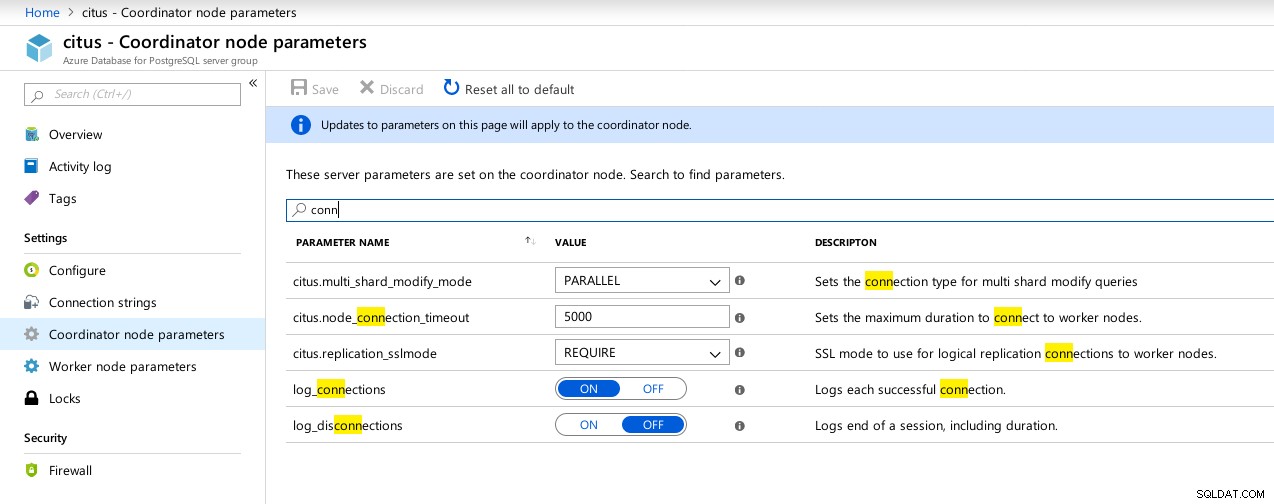 ハイパースケール(Citus)コーディネーター接続で使用可能なパラメーター
 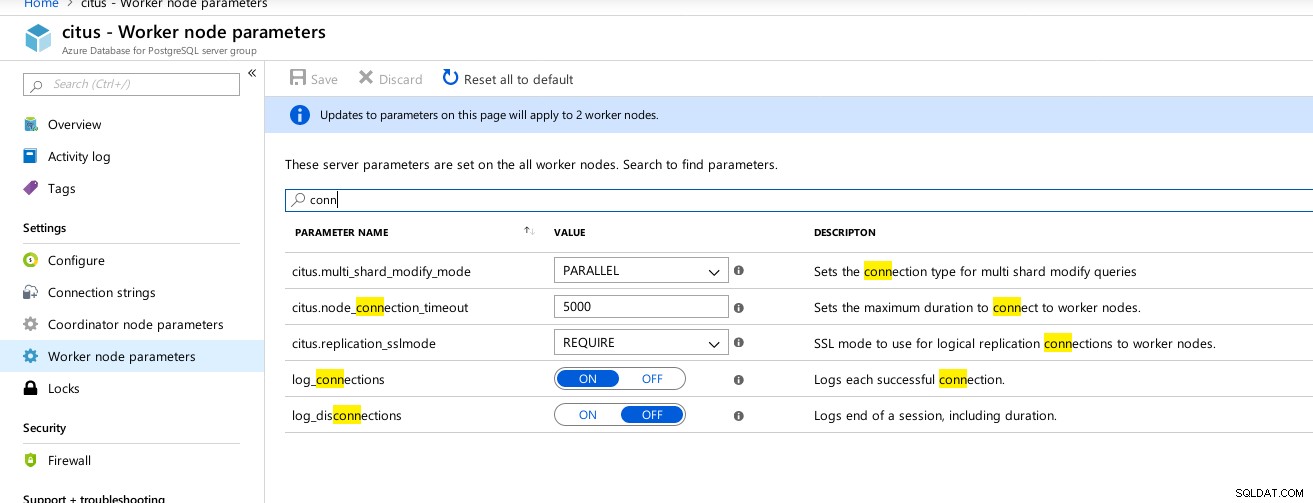 ハイパースケール(Citus)ワーカー:max_connectionsは利用できません
 ベンチマークメトリクス
クライアントとサーバーのパフォーマンス、および動作を示すいくつかのメトリック:
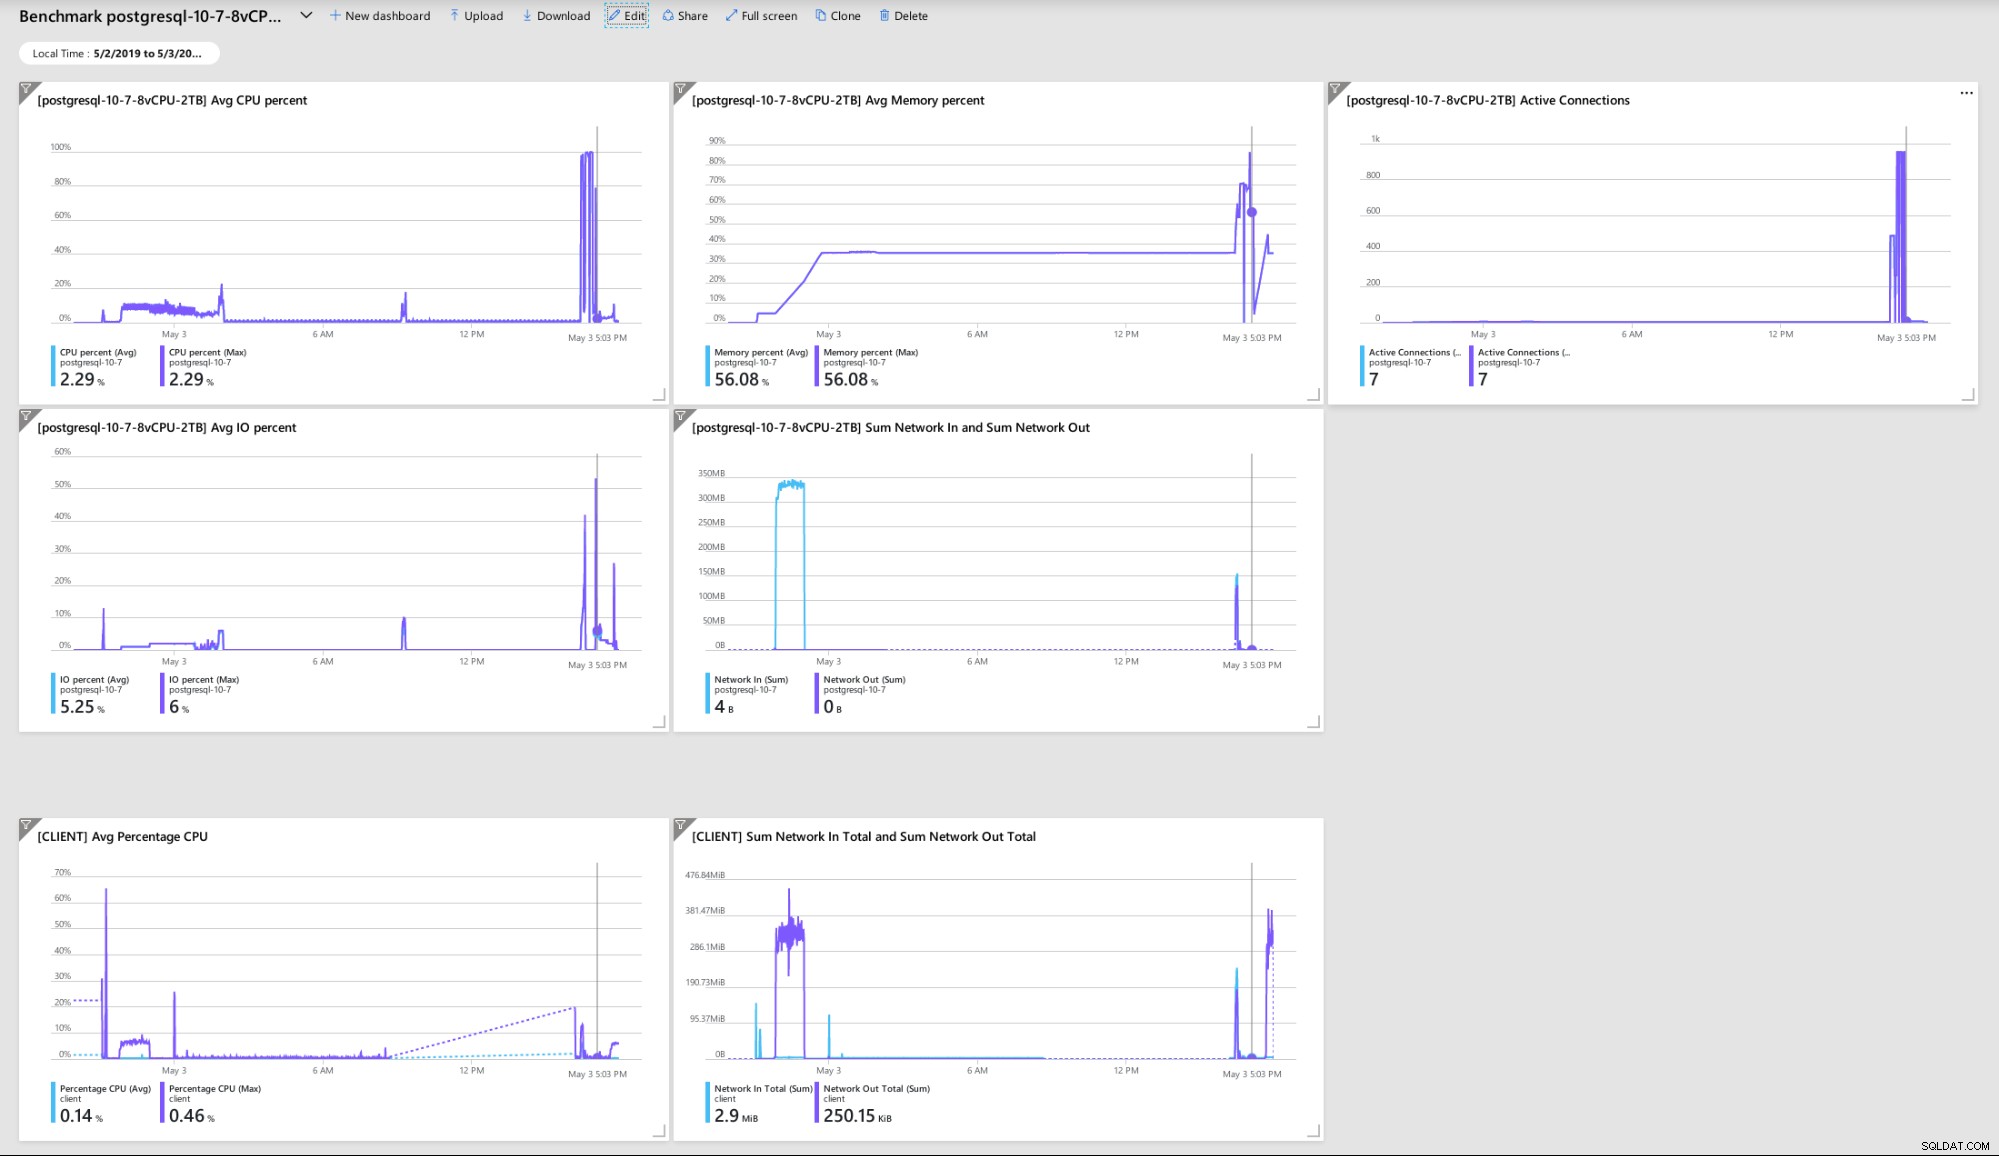 Azureポータルダッシュボード-クライアントとサーバーのメトリック
 Query Performance Insightを使用して収集されたPostgreSQLメトリック:
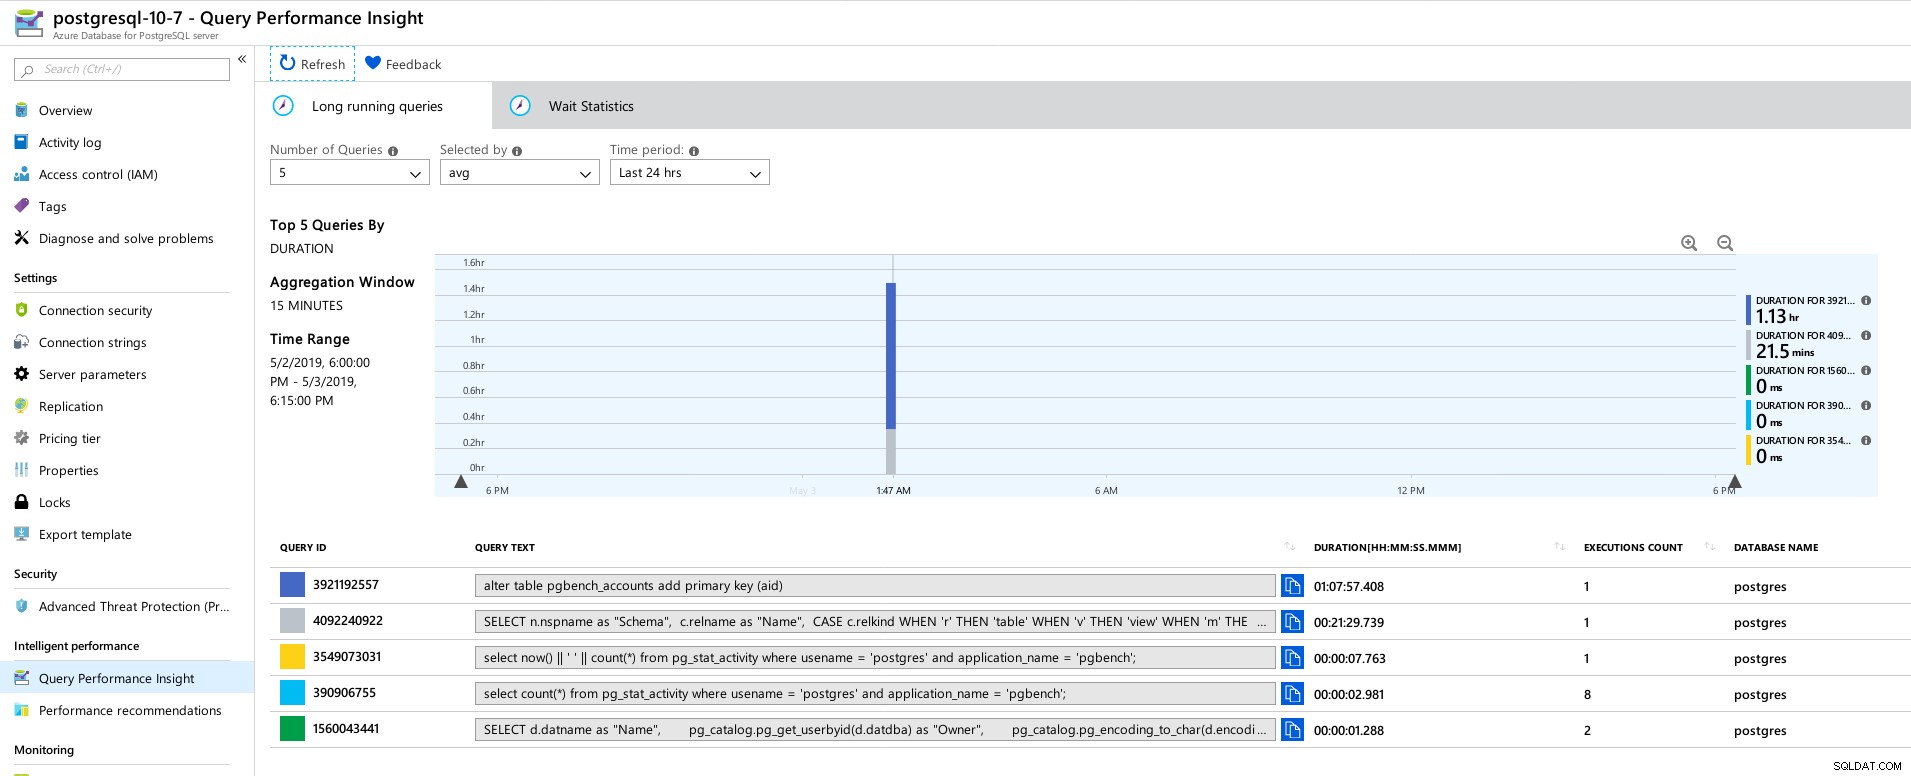 Azure PostgreSQL-クエリパフォーマンスインサイト:上位5つのクエリ
 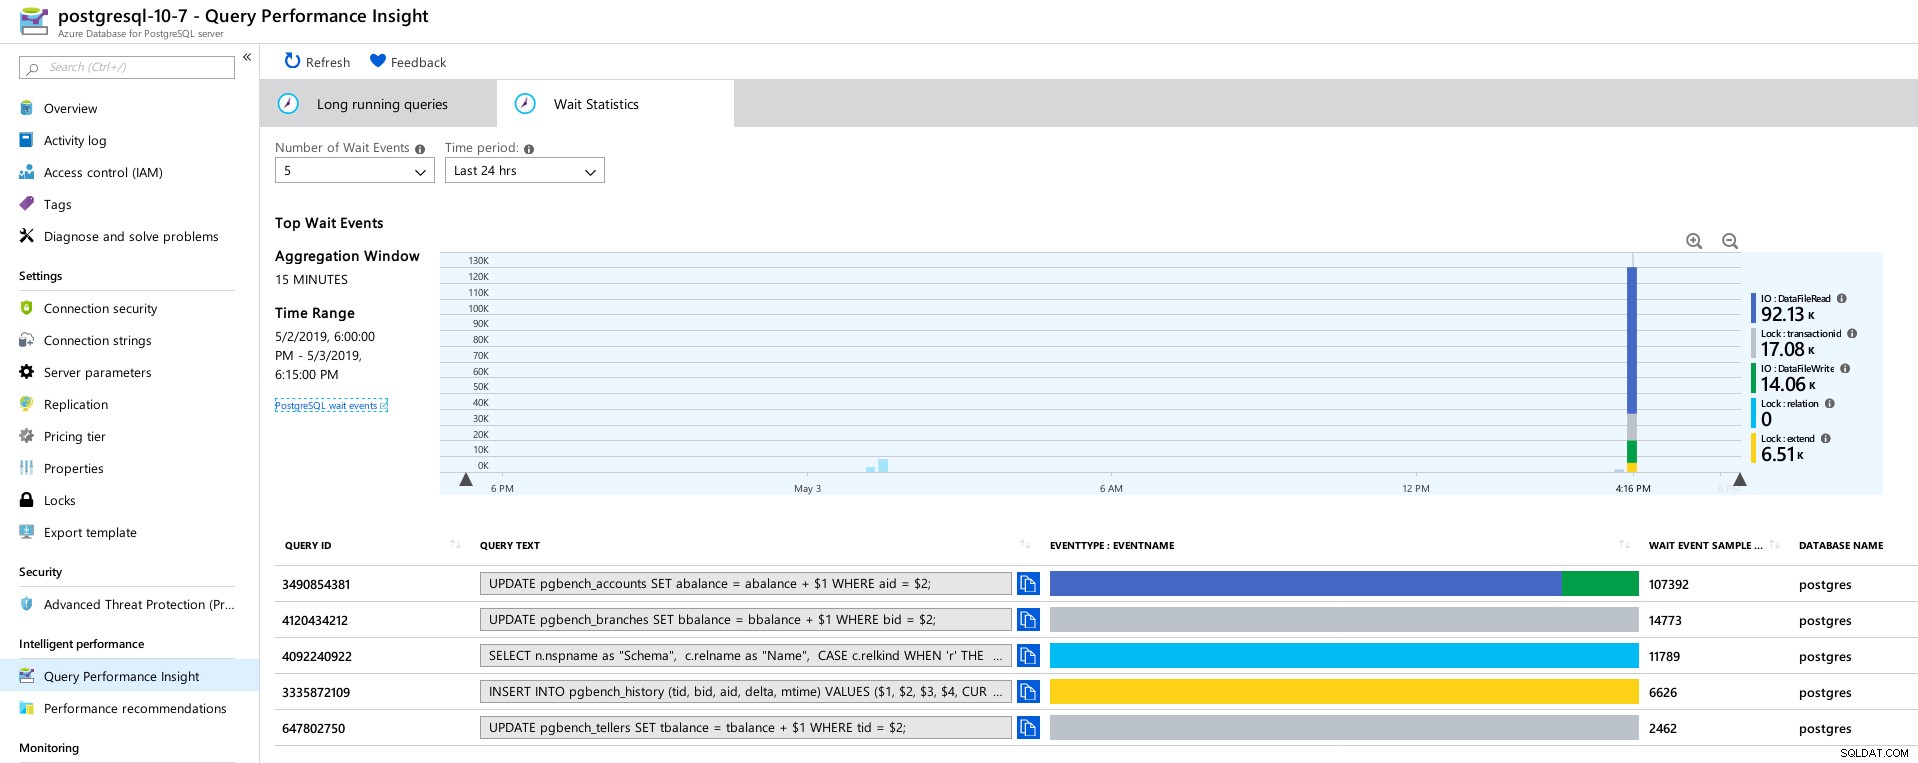 Azure PostgreSQL-クエリパフォーマンスインサイト:上位5つの待機
 結論
関連リソースベンチマークマネージドPostgreSQLクラウドソリューション-パート1:Amazon AuroraベンチマークマネージドPostgreSQLクラウドソリューション-パート2:Amazon RDSベンチマークマネージドPostgreSQLクラウドソリューション-パート3:Google Cloudまず、ここまで読んでいただきありがとうございます。また、環境の誤動作の原因となった可能性のある間違いを見つけた場合は、フィードバックをいただければ幸いです。明らかなことを見逃した場合は、テストを繰り返します。
「NTHARDERROR」16進ダンプにつながるデータベースエンジンのクラッシュは、ユーザーが制御できない何かが発生したことを示しており、自動化または担当のSREへのアラートによって適切なマネージドサービスが回復します。サービスが復元されるまでユーザーがどれくらい待たなければならないかという問題が発生しますが、それが当てはまる可能性があるより多くの時間を待っていたとしたら。
max_connectionsを価格帯とvCoresに基づく値にロックすると、特に他の3つのマネージドサービスをテストした後、デフォルト値がはるかに低くても、Google Cloudでユーザーがパラメーターを構成できるようになり、驚きました(Gでは600) Cloud vs 960 on Azure)。
デフォルト値の変更を回避するために、16コア範囲のデータベースインスタンスを使用したテストが必要になる場合がありますが、その時点では、HammerDBなどのより優れたツールを使用してテストすることをお勧めします(ツールの説明については、パート1を参照してください)。 。