マネージドPostgreSQLクラウドソリューションのベンチマークのこの第3部では 、GoogleのGCP無料利用枠サービスを利用しました。これは価値のある経験であり、ほとんどの時間をコンソールで過ごすsysadminとして、私がよく知っているクラウドプロバイダーとGoogleを際立たせるコンソール機能の1つであるクラウドシェルを試す機会を逃すことはできませんでした。 、アマゾンウェブサービス。
簡単に要約すると、パート1では、利用可能なベンチマークツールを確認し、AuroraにAWSベンチマーク手順を選択した理由を説明しました。また、PostgreSQLバージョン10.6用にAmazonAuroraのベンチマークを行いました。パート2では、AWS RDSforPostgreSQLバージョン11.1を確認しました。
このラウンドでは、バージョン11.1がまだベータ版であるため、AuroraのAWSベンチマーク手順に基づくテストがGoogle Cloud SQL forPostgreSQL9.6に対して実行されます。
クラウドインスタンス
前提条件
前の2つの記事で述べたように、テストの実行を妨げない限り、PostgreSQLの設定をクラウドGUCのデフォルトのままにすることを選択しました(以下を参照)。以前の記事から、妥当なパフォーマンスを提供するために、クラウドプロバイダーはデータベースインスタンスを構成する必要があると想定されていたことを思い出してください。
PostgreSQL9.6.5のAWSpgbenchタイミングパッチは、PostgreSQL9.6.10のGoogleCloudバージョンにクリーンに適用されました。
Googleがブログに掲載したGoogleCloudfor AWS Professionalsの情報を使用して、コンピューティング、ストレージ、ネットワーキングの各コンポーネントに関して、クライアントとターゲットインスタンスの仕様を一致させました。たとえば、AWS EnhancedNetworkingに相当するGoogleCloudは、次の式に基づいてコンピューティングノードのサイズを決定することで実現されます。
max( [vCPUs x 2Gbps/vCPU], 16Gbps)ターゲットデータベースインスタンスの設定に関しては、AWSと同様に、Google Cloudはレプリカを許可しませんが、ストレージは保存時に暗号化され、無効にするオプションはありません。
最後に、最高のネットワークパフォーマンスを実現するには、クライアントとターゲットインスタンスを同じアベイラビリティーゾーンに配置する必要があります。
クライアント
最も近いAWSインスタンスに一致するクライアントインスタンスの仕様は次のとおりです。
- vCPU:32(16コアx 2スレッド/コア)
- RAM:208 GiB(32 vCPUインスタンスの最大値)
- ストレージ:ComputeEngine永続ディスク
- ネットワーク:16 Gbps([32 vCPU x 2 Gbps /vCPU]および16Gbpsの最大値)
初期化後のインスタンスの詳細:
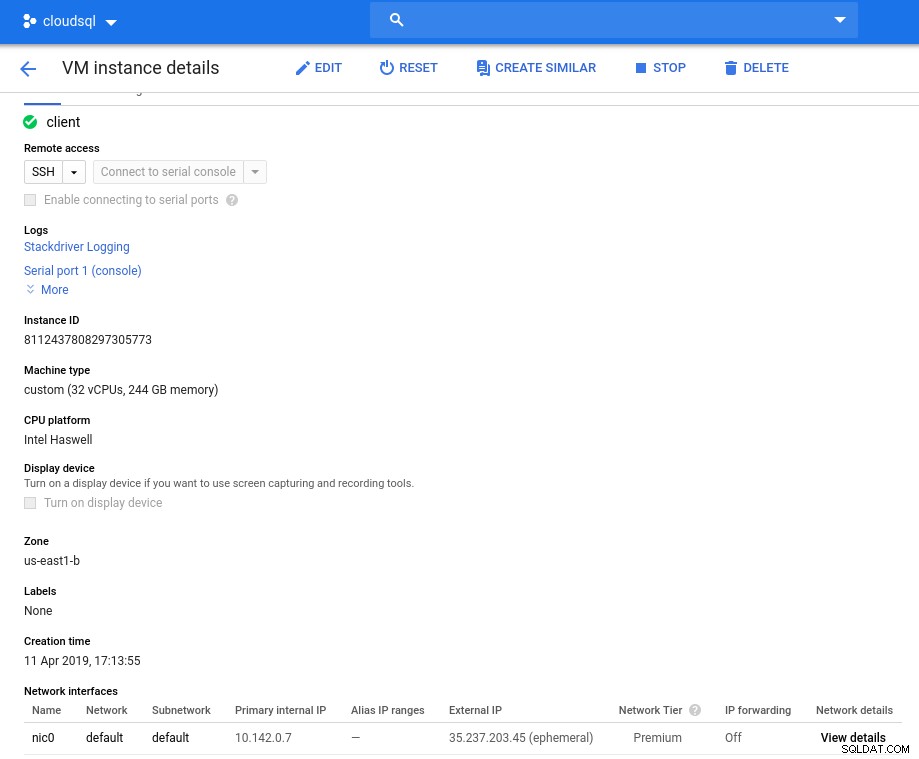 クライアントインスタンス:コンピューティングとネットワーク
 注:インスタンスはデフォルトで24個のvCPUに制限されています。 Googleテクニカルサポートは、インスタンスあたり32vCPUへの割り当ての増加を承認する必要があります。
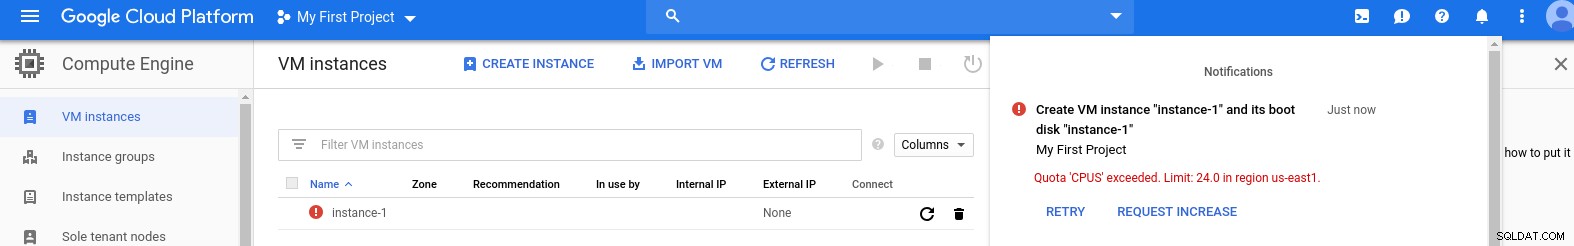
このようなリクエストは通常2営業日以内に処理されますが、Googleサポートサービスに2時間以内にリクエストを完了するための親指を立てる必要があります。
不思議なことに、ネットワーク速度の計算式は、このGCPブログで参照されているコンピューティングエンジンのドキュメントに基づいています。
DBクラスター
データベースインスタンスの仕様は次のとおりです。
- vCPU:8
- RAM:52 GiB(最大)
- ストレージ:144 MB / s、9,000 IOPS
- ネットワーク:2,000MB/秒
8vCPUインスタンスで使用可能な最大メモリは52GiBであることに注意してください。より大きなインスタンス(より多くのvCPU)を選択することで、より多くのメモリを割り当てることができます:
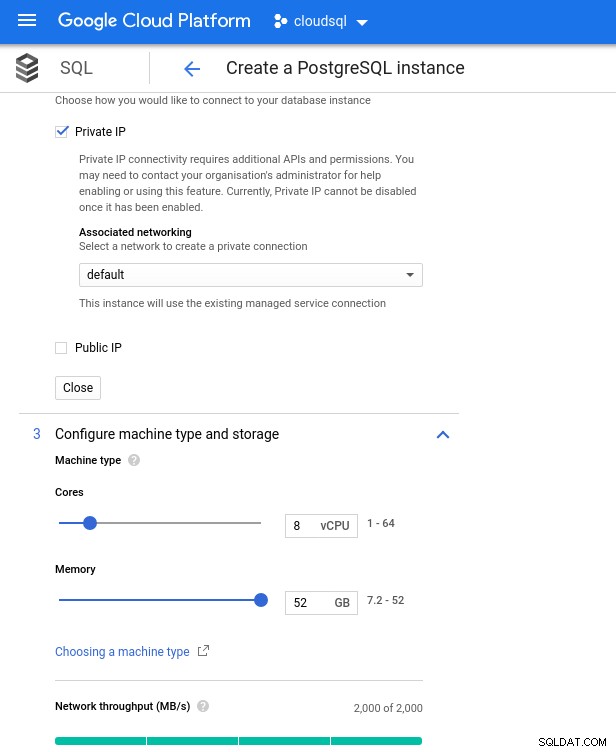 データベースのCPUとメモリのサイズ設定
 Google SQLは基盤となるストレージを自動的に拡張できますが、これは非常に優れた機能ですが、AWSの機能セットとの一貫性を保ち、サイズ変更操作中の潜在的なI / Oの影響を回避するために、このオプションを無効にすることにしました。 (「潜在的」。悪影響はまったくないはずですが、私の経験では、基盤となるストレージのタイプをサイズ変更すると、数秒間であってもI / Oが増加します)。
AWSデータベースインスタンスは、最大で以下を提供する最適化されたEBSストレージによってバックアップされたことを思い出してください:
- 1,700Mbpsの帯域幅
- 212.5MB/秒のスループット
- 12,000 IOPS
Google Cloudでは、vCPUの数(上記を参照)とストレージ容量を調整することで、同様の構成を実現しています。
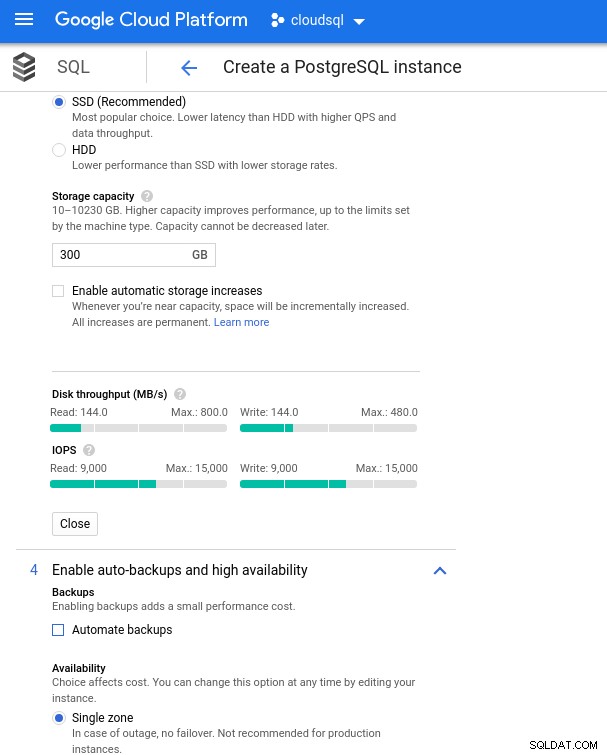 データベースのストレージ構成とバックアップ設定
 ベンチマークの実行
セットアップ
次に、PostgreSQLバージョン9.6.10に適合したAmazonガイドの指示に従って、ベンチマークツールであるpgbenchとsysbenchをインストールします。
.bashrcでPostgreSQL環境変数を初期化し、PostgreSQLバイナリとライブラリへのパスを設定します。
export PGHOST=10.101.208.7
export PGUSER=postgres
export PGPASSWORD=postgres
export PGDATABASE=postgres
export PGPORT=5432
export PATH=$PATH:/usr/local/pgsql/bin
export LD_LIBRARY_PATH=$LD_LIBRARY_PATH:/usr/local/pgsql/lib
飛行前チェックリスト:
[example@sqldat.com ~]# psql --version
psql (PostgreSQL) 9.6.10
[example@sqldat.com ~]# pgbench --version
pgbench (PostgreSQL) 9.6.10
[example@sqldat.com ~]# sysbench --version
sysbench 0.5
postgres=> select version();
                                                 version
---------------------------------------------------------------------------------------------------------
 PostgreSQL 9.6.10 on x86_64-pc-linux-gnu, compiled by gcc (Ubuntu 4.8.4-2ubuntu1~14.04.3) 4.8.4, 64-bit
(1 row)
そして、離陸の準備ができています:
pgbench
pgbenchデータベースを初期化します。
[example@sqldat.com ~]# pgbench -i --fillfactor=90 --scale=10000…そして数分後:
NOTICE:  table "pgbench_history" does not exist, skipping
NOTICE:  table "pgbench_tellers" does not exist, skipping
NOTICE:  table "pgbench_accounts" does not exist, skipping
NOTICE:  table "pgbench_branches" does not exist, skipping
creating tables...
100000 of 1000000000 tuples (0%) done (elapsed 0.09 s, remaining 872.42 s)
200000 of 1000000000 tuples (0%) done (elapsed 0.19 s, remaining 955.00 s)
300000 of 1000000000 tuples (0%) done (elapsed 0.33 s, remaining 1105.08 s)
400000 of 1000000000 tuples (0%) done (elapsed 0.53 s, remaining 1317.56 s)
500000 of 1000000000 tuples (0%) done (elapsed 0.63 s, remaining 1258.72 s)

...

500000000 of 1000000000 tuples (50%) done (elapsed 943.93 s, remaining 943.93 s)
500100000 of 1000000000 tuples (50%) done (elapsed 944.08 s, remaining 943.71 s)
500200000 of 1000000000 tuples (50%) done (elapsed 944.22 s, remaining 943.46 s)
500300000 of 1000000000 tuples (50%) done (elapsed 944.33 s, remaining 943.20 s)
500400000 of 1000000000 tuples (50%) done (elapsed 944.47 s, remaining 942.96 s)
500500000 of 1000000000 tuples (50%) done (elapsed 944.59 s, remaining 942.70 s)
500600000 of 1000000000 tuples (50%) done (elapsed 944.73 s, remaining 942.47 s)

...

999600000 of 1000000000 tuples (99%) done (elapsed 1878.28 s, remaining 0.75 s)
999700000 of 1000000000 tuples (99%) done (elapsed 1878.41 s, remaining 0.56 s)
999800000 of 1000000000 tuples (99%) done (elapsed 1878.58 s, remaining 0.38 s)
999900000 of 1000000000 tuples (99%) done (elapsed 1878.70 s, remaining 0.19 s)
1000000000 of 1000000000 tuples (100%) done (elapsed 1878.83 s, remaining 0.00 s)
vacuum...
set primary keys...
total time: 5978.44 s (insert 1878.90 s, commit 0.04 s, vacuum 2484.96 s, index 1614.54 s)
done.
今では慣れているように、データベースのサイズは160GBである必要があります。次のことを確認しましょう:
postgres=>  SELECT
postgres->       d.datname AS Name,
postgres->       pg_catalog.pg_get_userbyid(d.datdba) AS Owner,
postgres->       pg_catalog.pg_size_pretty(pg_catalog.pg_database_size(d.datname)) AS SIZE
postgres->    FROM pg_catalog.pg_database d
postgres->    WHERE d.datname = 'postgres';
   name   |       owner       |  size
----------+-------------------+--------
postgres | cloudsqlsuperuser | 160 GB
(1 row)
すべての準備が完了したら、読み取り/書き込みテストを開始します。
[example@sqldat.com ~]# pgbench --protocol=prepared -P 60 --time=600 --client=1000 --jobs=2048
starting vacuum...end.
connection to database "postgres" failed:
FATAL:  sorry, too many clients already :: proc.c:341
connection to database "postgres" failed:
FATAL:  sorry, too many clients already :: proc.c:341
connection to database "postgres" failed:
FATAL:  remaining connection slots are reserved for non-replication superuser connections
おっと!最大値はいくつですか?
postgres=> show max_connections ;
 max_connections
-----------------
 600
(1 row)
そのため、AWSはその問題に遭遇しなかったため、ほぼ十分なmax_connectionsを設定しますが、Google Cloudには微調整が必要です...クラウドコンソールに戻り、データベースパラメータを更新し、数分待ってから確認してください:
postgres=> show max_connections ;
 max_connections
-----------------
 1005
(1 row)
テストを再開すると、すべてが正常に機能しているように見えます:
starting vacuum...end.
progress: 60.0 s, 5461.7 tps, lat 172.821 ms stddev 251.666
progress: 120.0 s, 4444.5 tps, lat 225.162 ms stddev 365.695
progress: 180.0 s, 4338.5 tps, lat 230.484 ms stddev 373.998
...しかし、別の落とし穴があります。接続数をカウントするために新しいpsqlセッションを開こうとしたとき、私は驚きました:
psql: FATAL: remaining connection slots are reserved for non-replication superuser connectionssuperuser_reserved_connectionsがデフォルトになっていない可能性がありますか?
postgres=> show superuser_reserved_connections ;
 superuser_reserved_connections
--------------------------------
 3
(1 row)
これがデフォルトですが、他に何ができるでしょうか?
postgres=> select usename from pg_stat_activity ;
   usename
---------------
cloudsqladmin
cloudsqlagent
postgres
(3 rows)
ビンゴ! max_connectionsの別のバンプがそれを処理しますが、pgbenchテストを再起動する必要がありました。そして、それは人々が下のグラフの明らかな重複実行の背後にある物語です。
そして最後に、結果は次のとおりです。
progress: 60.0 s, 4553.6 tps, lat 194.696 ms stddev 250.663
progress: 120.0 s, 3646.5 tps, lat 278.793 ms stddev 434.459
progress: 180.0 s, 3130.4 tps, lat 332.936 ms stddev 711.377
progress: 240.0 s, 3998.3 tps, lat 250.136 ms stddev 319.215
progress: 300.0 s, 3305.3 tps, lat 293.250 ms stddev 549.216
progress: 360.0 s, 3547.9 tps, lat 289.526 ms stddev 454.484
progress: 420.0 s, 3770.5 tps, lat 265.977 ms stddev 470.451
progress: 480.0 s, 3050.5 tps, lat 327.917 ms stddev 643.983
progress: 540.0 s, 3591.7 tps, lat 273.906 ms stddev 482.020
progress: 600.0 s, 3350.9 tps, lat 296.303 ms stddev 566.792
transaction type: <builtin: TPC-B (sort of)>
scaling factor: 10000
query mode: prepared
number of clients: 1000
number of threads: 1000
duration: 600 s
number of transactions actually processed: 2157735
latency average = 278.149 ms
latency stddev = 503.396 ms
tps = 3573.331659 (including connections establishing)
tps = 3591.759513 (excluding connections establishing)
sysbench
データベースにデータを入力します:
sysbench --test=/usr/local/share/sysbench/oltp.lua \
--pgsql-host=${PGHOST} \
--pgsql-db=${PGDATABASE} \
--pgsql-user=${PGUSER} \
--pgsql-password=${PGPASSWORD} \
--pgsql-port=${PGPORT} \
--oltp-tables-count=250\
--oltp-table-size=450000 \
prepare
出力:
sysbench 0.5:  multi-threaded system evaluation benchmark
Creating table 'sbtest1'...
Inserting 450000 records into 'sbtest1'
Creating secondary indexes on 'sbtest1'...
Creating table 'sbtest2'...
Inserting 450000 records into 'sbtest2'
...
Creating table 'sbtest249'...
Inserting 450000 records into 'sbtest249'
Creating secondary indexes on 'sbtest249'...
Creating table 'sbtest250'...
Inserting 450000 records into 'sbtest250'
Creating secondary indexes on 'sbtest250'...
そして今、テストを実行します:
sysbench --test=/usr/local/share/sysbench/oltp.lua \
--pgsql-host=${PGHOST} \
--pgsql-db=${PGDATABASE} \
--pgsql-user=${PGUSER} \
--pgsql-password=${PGPASSWORD} \
--pgsql-port=${PGPORT} \
--oltp-tables-count=250 \
--oltp-table-size=450000 \
--max-requests=0 \
--forced-shutdown \
--report-interval=60 \
--oltp_simple_ranges=0 \
--oltp-distinct-ranges=0 \
--oltp-sum-ranges=0 \
--oltp-order-ranges=0 \
--oltp-point-selects=0 \
--rand-type=uniform \
--max-time=600 \
--num-threads=1000 \
run
そして結果:
sysbench 0.5:  multi-threaded system evaluation benchmark

Running the test with following options:
Number of threads: 1000
Report intermediate results every 60 second(s)
Random number generator seed is 0 and will be ignored

Forcing shutdown in 630 seconds

Initializing worker threads...

Threads started!

[  60s] threads: 1000, tps: 1320.25, reads: 0.00, writes: 5312.62, response time: 1484.54ms (95%), errors: 0.00, reconnects:  0.00
[ 120s] threads: 1000, tps: 1486.77, reads: 0.00, writes: 5944.30, response time: 1290.87ms (95%), errors: 0.00, reconnects:  0.00
[ 180s] threads: 1000, tps: 1143.62, reads: 0.00, writes: 4585.67, response time: 1649.50ms (95%), errors: 0.02, reconnects:  0.00
[ 240s] threads: 1000, tps: 1498.23, reads: 0.00, writes: 5993.06, response time: 1269.03ms (95%), errors: 0.00, reconnects:  0.00
[ 300s] threads: 1000, tps: 1520.53, reads: 0.00, writes: 6058.57, response time: 1439.90ms (95%), errors: 0.02, reconnects:  0.00
[ 360s] threads: 1000, tps: 1234.57, reads: 0.00, writes: 4958.08, response time: 1550.39ms (95%), errors: 0.02, reconnects:  0.00
[ 420s] threads: 1000, tps: 1722.25, reads: 0.00, writes: 6890.98, response time: 1132.25ms (95%), errors: 0.00, reconnects:  0.00
[ 480s] threads: 1000, tps: 2306.25, reads: 0.00, writes: 9233.84, response time: 842.11ms (95%), errors: 0.00, reconnects:  0.00
[ 540s] threads: 1000, tps: 1432.85, reads: 0.00, writes: 5720.15, response time: 1709.83ms (95%), errors: 0.02, reconnects:  0.00
[ 600s] threads: 1000, tps: 1332.93, reads: 0.00, writes: 5347.10, response time: 1443.78ms (95%), errors: 0.02, reconnects:  0.00
OLTP test statistics:
   queries performed:
      read:                            0
      write:                           3603595
      other:                           1801795
      total:                           5405390
   transactions:                        900895 (1500.68 per sec.)
   read/write requests:                 3603595 (6002.76 per sec.)
   other operations:                    1801795 (3001.38 per sec.)
   ignored errors:                      5      (0.01 per sec.)
   reconnects:                          0      (0.00 per sec.)

General statistics:
   total time:                          600.3231s
   total number of events:              900895
   total time taken by event execution: 600164.2510s
   response time:
         min:                                  6.78ms
         avg:                                666.19ms
         max:                               4218.55ms
         approx.  95 percentile:            1397.02ms

Threads fairness:
   events (avg/stddev):           900.8950/14.19
execution time (avg/stddev): 600.1643/0.10ベンチマークメトリクス
Stackdriver用のPostgreSQLプラグインは、2019年2月28日をもって廃止されました。GoogleはBlue Medoraを推奨していますが、この記事の目的上、アカウントの作成を廃止し、利用可能なStackdriverメトリックに依存することを選択しました。
- CPU使用率:
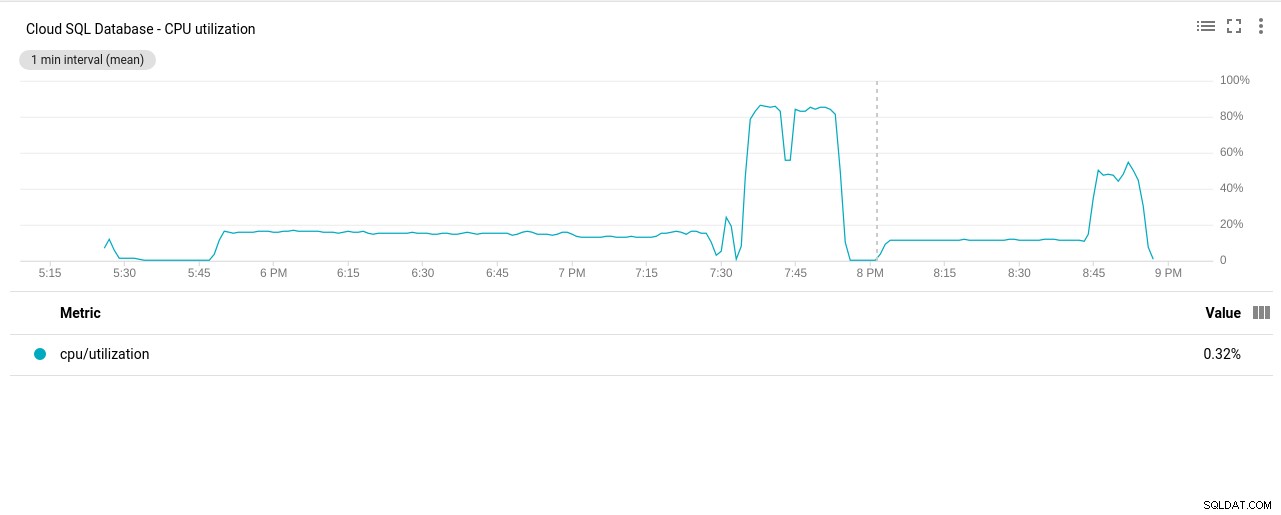 写真作成者GoogleCloudSQL:PostgreSQLCPU使用率
 - ディスクの読み取り/書き込み操作:
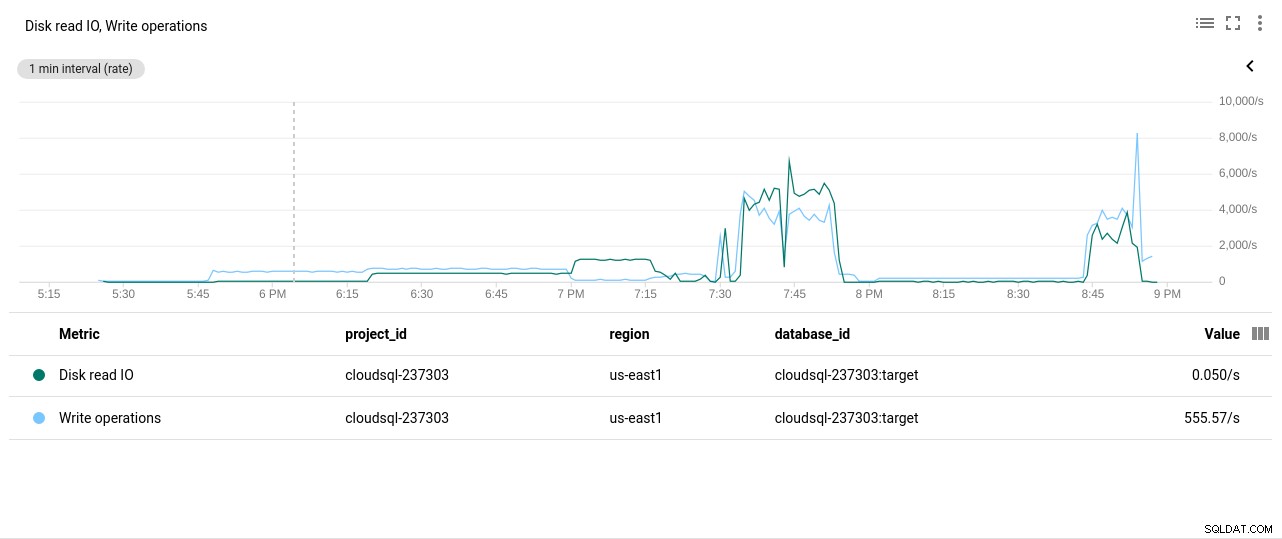 写真作成者GoogleCloudSQL:PostgreSQLディスクの読み取り/書き込み操作
 - ネットワークの送信/受信バイト:
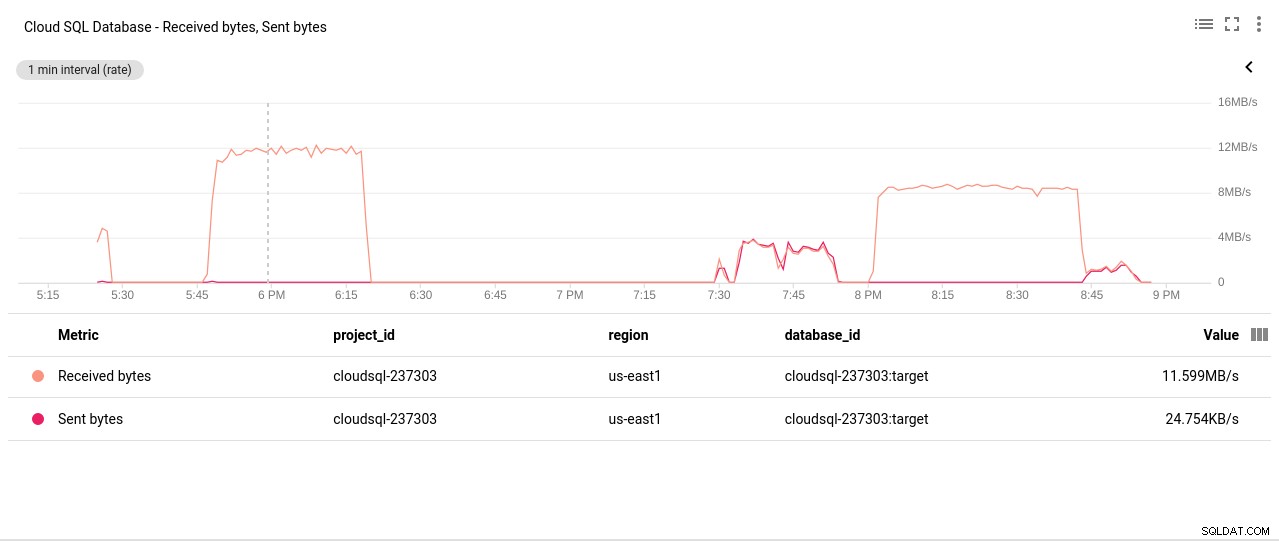 写真作成者GoogleCloudSQL:PostgreSQLネットワークの送受信バイト
 - PostgreSQL接続数:
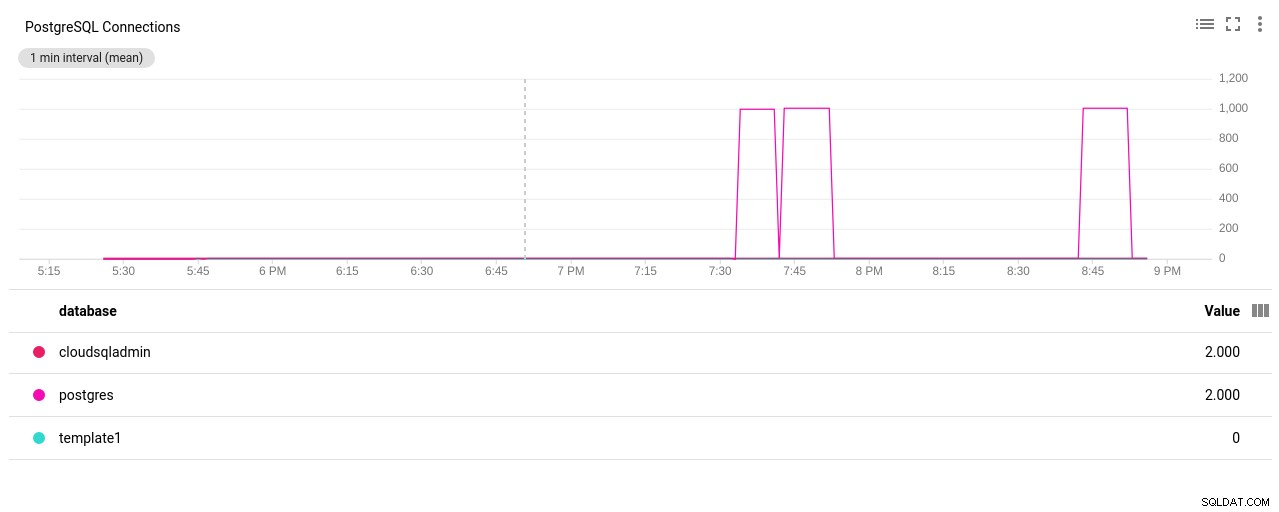 写真の作成者GoogleCloudSQL:PostgreSQL接続数
ベンチマーク結果
pgbenchの初期化
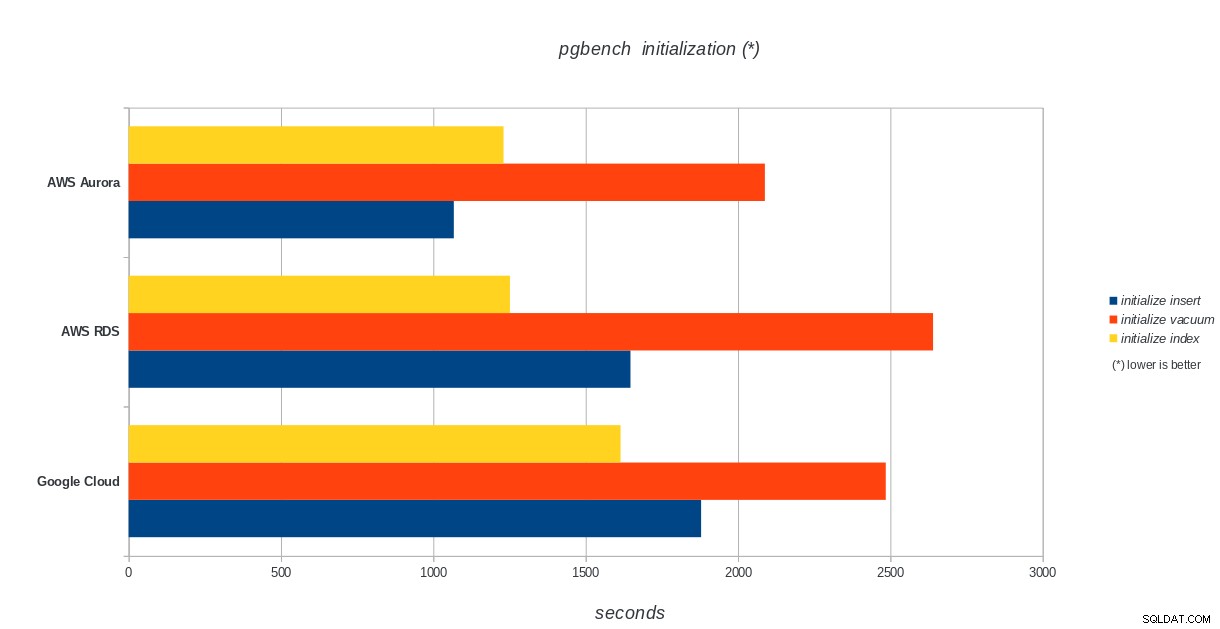 AWS Aurora、AWS RDS、Google Cloud SQL:PostgreSQLpgbenchの初期化結果
 pgbench run
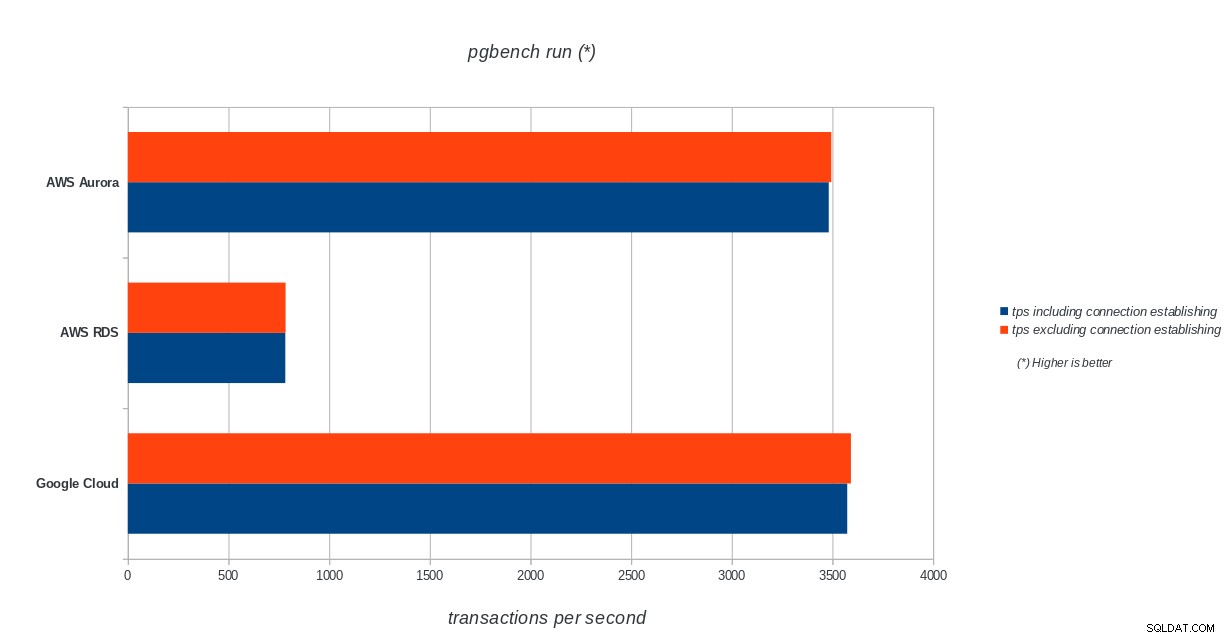 AWS Aurora、AWS RDS、Google Cloud SQL:PostgreSQLpgbenchの実行結果
 sysbench
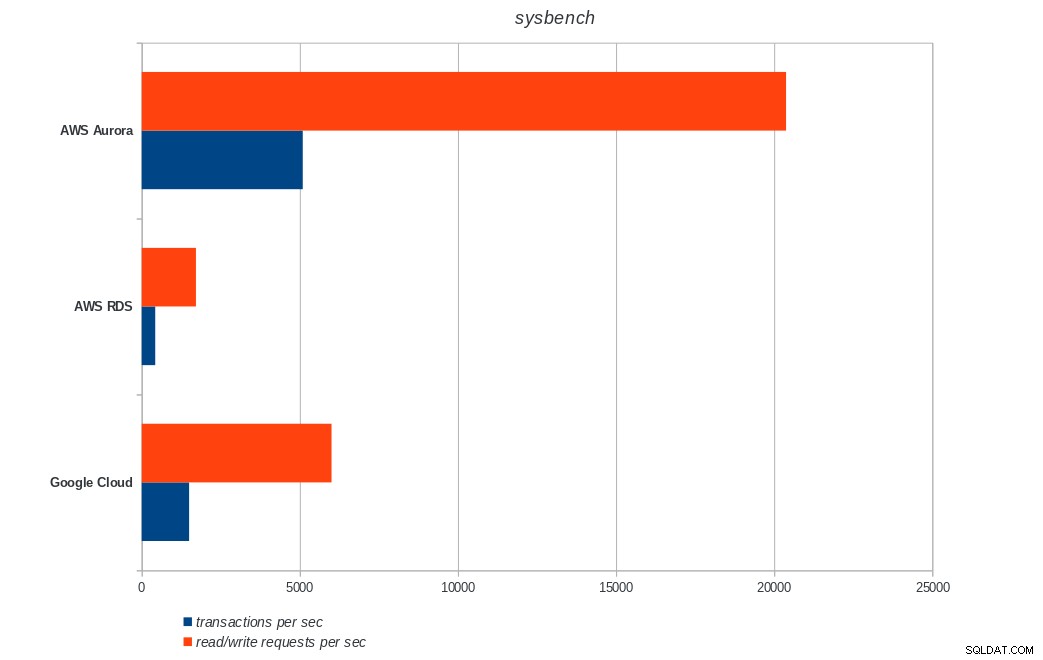 AWS Aurora、AWS RDS、Google Cloud SQL:PostgreSQLsysbenchの結果
 結論
Amazon Auroraは、書き込みが多い(sysbench)テストで圧倒的に最初になりますが、pgbenchの読み取り/書き込みテストではGoogleCloudSQLと同等です。負荷テスト(pgbenchの初期化)では、最初にGoogle Cloud SQLが配置され、次にAmazonRDSが配置されます。 AWSAuroraとGoogleCloudSQLの価格モデルをざっと見てみると、平均的なユーザーにはすぐに使えるGoogle Cloudの方が適しているのに対し、AWSAuroraは高性能環境に適していると言っても過言ではありません。すべてのベンチマークを完了した後、さらに分析を行います。
このベンチマークシリーズの次の最後の部分は、MicrosoftAzurePostgreSQLで行われます。
読んでいただきありがとうございます。フィードバックがある場合は、以下にコメントしてください。