このブログは、クラウドでのPostgreSQLのベンチマークに関する私の旅を文書化したマルチシリーズを開始します。
最初の部分には、ベンチマークツールの概要が含まれており、AmazonAuroraPostgreSQLの楽しみを開始します。
PostgreSQLクラウドサービスプロバイダーの選択
少し前に、AuroraのAWSベンチマーク手順に出くわしました。そのテストを受けて、他のクラウドホスティングプロバイダーで実行できれば、本当にすばらしいと思いました。アマゾンの名誉のために、AWS、Google、Microsoftの3つの最も有名なユーティリティコンピューティングプロバイダーのうち、AWSはPostgreSQL開発への唯一の主要な貢献者であり、マネージドPostgreSQLサービスを最初に提供しました(2013年11月にさかのぼります)。
>マネージドPostgreSQLサービスは多数のPostgreSQLホスティングプロバイダーからも利用できますが、クラウドコンピューティングの利点を探している多くの組織がアプリケーションを実行することを選択する環境であるため、これら3つのクラウドコンピューティングプロバイダーに焦点を当てたいと思いました。 PostgreSQLの管理に必要なノウハウ。今日のIT環境では、クラウドで重要なワークロードを処理している組織は、GUCSの複雑な世界や無数のSlideShareプレゼンテーションをナビゲートするのに役立つ、特殊なPostgreSQLサービスプロバイダーのサービスから大きな恩恵を受けると確信しています。
適切なベンチマークツールの選択
PostgreSQLのベンチマークは、パフォーマンスメーリングリストに頻繁に登場します。何度も強調されているように、テストは実際のアプリケーションの構成を検証することを目的としていません。ただし、意味のある結果を収集するには、適切なベンチマークツールとパラメーターを選択することが重要です。特に最初のクラウドエクスペリエンスが適切に開始されない可能性がある場合は、すべてのクラウドプロバイダーがサービスのベンチマーク手順を提供することを期待します。幸いなことに、このテストの3人のプレーヤーのうち2人は、ドキュメントにベンチマークを含めています。 AWSベンチマーク手順forAuroraガイドは簡単に見つけることができ、AmazonAuroraResourcesページから直接入手できます。 GoogleはPostgreSQLに固有のガイドを提供していませんが、Compute Engineのドキュメントには、HammerDBに基づくSQLServerの負荷テストガイドが含まれています。
以下は、参照に基づくベンチマークツールの概要です。
- 上記のAWSベンチマークは、pgbenchとsysbenchに基づいています。
- 前述のHammerDBについては、pgsql-hackersリストの最近の投稿で説明されています。
- この他のpgsql-hackersの議論でほのめかされているように、oltpbenchに基づくTPC-Cテスト。
- branchmarksqlは、Bツリーページ分割への変更を検証するために使用されたさらに別のTPC-Cテストです。
- pg_ycsbは町の新しい子供で、pgbenchを改良し、PostgreSQLハッカーの一部によってすでに使用されています。
- pgbench-toolsは、その名前が示すように、pgbenchに基づいており、2016年以降更新を受け取っていませんが、PostgreSQLHighPerformanceの本の著者であるGregSmithの製品です。
- 結合順序ベンチマークは、クエリオプティマイザをテストするベンチマークです。
- コマンドプロンプトのブログを読んでいるときに出くわしたpgreplayは、実際のシナリオのベンチマークにできる限り近づいています。
もう1つの注意点は、PostgreSQLはまだTPC-Hベンチマーク標準に適していないことです。上記のように、すべてのツール(pgreplayを除く)はTPC-Cモードで実行する必要があります(pgbenchのデフォルトはこれです)。
>このブログの目的上、AuroraのAWSベンチマーク手順は、クラウドプロバイダーの標準を設定し、広く使用されているツールに基づいているという理由だけで、良いスタートを切ることができると思いました。
また、当時入手可能な最新のPostgreSQLバージョンを使用しました。クラウドプロバイダーを選択するときは、特に新しいバージョンによって導入された重要な機能がパフォーマンスに影響を与える可能性がある場合(バージョン10および11と9の場合)、アップグレードの頻度を考慮することが重要です。この記事の執筆時点では、次のようになっています。
- Amazon Aurora PostgreSQL 10.6
- Amazon RDS for PostgreSQL 10.6
- Google Cloud SQL for PostgreSQL 9.6
- Microsoft Azure PostgreSQL 10.5
...そしてここでの勝者は、最新バージョンを提供するAWSです(ただし、この記事の執筆時点では最新ではありませんが、11.2です)。
ベンチマーク環境の設定
いくつかの理由から、テストを平均的なワークロードに制限することにしました。まず、利用可能なクラウドリソースがプロバイダー間で同一ではないことです。ガイドでは、データベースインスタンスのAWS仕様は64 vCPU / 488 GiB RAM / 25ギガビットネットワークですが、インスタンスサイズ(Google Calculatorで「カスタム」に設定する必要があります)に対するGoogleの最大RAMは208GiBです。また、32vCPUのMicrosoftのBusinessCritical Gen5には、163GiBしか付属していません。次に、pgbenchの初期化により、データベースサイズが160GiBになります。これは、488GiBのRAMを搭載したインスタンスの場合にメモリに保存される可能性があります。
また、PostgreSQLの構成はそのままにしておきました。クラウドプロバイダーのデフォルトに固執する理由は、標準のベンチマークによってストレスがかかると、すぐに使用できる状態で、マネージドサービスが適度に良好に機能することが期待されるためです。 PostgreSQLコミュニティは、リリース管理プロセスの一部としてpgbenchテストを実行することを忘れないでください。さらに、AWSガイドにはデフォルトのPostgreSQL構成への変更については記載されていません。
ガイドで説明されているように、AWSはpgbenchに2つのパッチを適用しました。クライアント数のパッチが10.6バージョンのPostgreSQLに適切に適用されず、修正に時間をかけたくなかったため、クライアント数は最大1,000に制限されました。
このガイドでは、クライアントインスタンスで拡張ネットワーキングを有効にするための要件を指定しています—このインスタンスタイプはデフォルトです:
[example@sqldat.com ~]$ ip a
1: lo: <LOOPBACK,UP,LOWER_UP> mtu 65536 qdisc noqueue state UNKNOWN group default qlen 1000
    link/loopback 00:00:00:00:00:00 brd 00:00:00:00:00:00
    inet 127.0.0.1/8 scope host lo
       valid_lft forever preferred_lft forever
    inet6 ::1/128 scope host
       valid_lft forever preferred_lft forever
2: eth0: <BROADCAST,MULTICAST,UP,LOWER_UP> mtu 9001 qdisc mq state UP group default qlen 1000
    link/ether 0a:cd:ee:40:2b:e6 brd ff:ff:ff:ff:ff:ff
    inet 172.31.19.190/20 brd 172.31.31.255 scope global eth0
       valid_lft forever preferred_lft forever
    inet6 fe80::8cd:eeff:fe40:2be6/64 scope link
       valid_lft forever preferred_lft forever
[example@sqldat.com ~]$ ethtool -i eth0
driver: ena
version: 2.0.2g
firmware-version:
bus-info: 0000:00:03.0
supports-statistics: yes
supports-test: no
supports-eeprom-access: no
supports-register-dump: no
supports-priv-flags: no
>>> aws (master *%) ~ $ aws ec2 describe-instances --instance-ids i-0ee51642334c1ec57 --query "Reservations[].Instances[].EnaSupport"
[
    true
]
AmazonAuroraPostgreSQLでベンチマークを実行する
実際の実行中に、ガイドからもう1つ逸脱することにしました。テストを1時間実行する代わりに、制限時間を10分に設定します。これは、一般的に適切な値として受け入れられています。
実行#1
詳細 - このテストでは、クライアントとデータベースの両方のインスタンスサイズにAWS仕様を使用します。
- クライアントマシン:オンデマンドメモリ最適化EC2インスタンス:
- vCPU:32(16コアx 2スレッド/コア)
- RAM:244 GiB
- ストレージ:EBS最適化
- ネットワーク:10ギガビット
- DBクラスター:db.r4.16xlarge
- vCPU:64
- ECU(CPU容量):195 x [1.0-1.2 GHz] 2007 Opteron / Xeon
- RAM:488 GiB
- ストレージ:EBS最適化(I / O専用容量)
- ネットワーク:25Gpsネットワークで最大帯域幅14,000Mbps
- データベースのセットアップには1つのレプリカが含まれていました。
- データベースストレージは暗号化されていません。
テストと結果の実行
- ガイドの指示に従って、pgbenchとsysbenchをインストールします。
- 〜/ .bashrcを編集して、データベース接続の環境変数とPostgreSQLライブラリへの必要なパスを設定します。
export PGHOST=aurora.cluster-ctfirtyhadgr.us-east-1.rds.amazonaws.com
export PGUSER=postgres
export PGPASSWORD=postgres
export PGDATABASE=postgres
export PATH=$PATH:/usr/local/pgsql/bin
export LD_LIBRARY_PATH=$LD_LIBRARY_PATH:/usr/local/pgsql/lib
- データベースを初期化します:
[example@sqldat.com ~]# pgbench -i --fillfactor=90 --scale=10000
NOTICE:  table "pgbench_history" does not exist, skipping
NOTICE:  table "pgbench_tellers" does not exist, skipping
NOTICE:  table "pgbench_accounts" does not exist, skipping
NOTICE:  table "pgbench_branches" does not exist, skipping
creating tables...
100000 of 1000000000 tuples (0%) done (elapsed 0.05 s, remaining 457.23 s)
200000 of 1000000000 tuples (0%) done (elapsed 0.13 s, remaining 631.70 s)
300000 of 1000000000 tuples (0%) done (elapsed 0.21 s, remaining 688.29 s)

...

999500000 of 1000000000 tuples (99%) done (elapsed 811.41 s, remaining 0.41 s)
999600000 of 1000000000 tuples (99%) done (elapsed 811.50 s, remaining 0.32 s)
999700000 of 1000000000 tuples (99%) done (elapsed 811.58 s, remaining 0.24 s)
999800000 of 1000000000 tuples (99%) done (elapsed 811.65 s, remaining 0.16 s)
999900000 of 1000000000 tuples (99%) done (elapsed 811.73 s, remaining 0.08 s)
1000000000 of 1000000000 tuples (100%) done (elapsed 811.80 s, remaining 0.00 s)
vacuum...
set primary keys...
done.
- データベースのサイズを確認します。
postgres=> \l+ postgres
                                                                 List of databases
   Name   |  Owner   | Encoding |   Collate   |    Ctype    | Access privileges |  Size  | Tablespace |                Description
----------+----------+----------+-------------+-------------+-------------------+--------+------------+--------------------------------------------
 postgres | postgres | UTF8     | en_US.UTF-8 | en_US.UTF-8 |                   | 160 GB | pg_default | default administrative connection database
(1 row)
- 次のクエリを使用して、チェックポイント間の時間間隔が設定されていることを確認します。これにより、チェックポイントは10分間の実行中に強制されます。
SELECT
   total_checkpoints,
   seconds_since_start / total_checkpoints / 60 AS minutes_between_checkpoints FROM (
      SELECT EXTRACT(
      EPOCH FROM (
         now() - pg_postmaster_start_time()
      )
      ) AS seconds_since_start,
   (checkpoints_timed+checkpoints_req) AS total_checkpoints
FROM pg_stat_bgwriter) AS sub;
結果:postgres=> \e
total_checkpoints | minutes_between_checkpoints
-------------------+-----------------------------
50 | 0.977392292333333
(1 row)
- 読み取り/書き込みワークロードを実行します:
[example@sqldat.com ~]# pgbench --protocol=prepared -P 60 --time=600 --client=1000 --jobs=2048
出力starting vacuum...end.
progress: 60.0 s, 35670.3 tps, lat 27.243 ms stddev 10.915
progress: 120.0 s, 36569.5 tps, lat 27.352 ms stddev 11.859
progress: 180.0 s, 35845.2 tps, lat 27.896 ms stddev 12.785
progress: 240.0 s, 36613.7 tps, lat 27.310 ms stddev 11.804
progress: 300.0 s, 37323.4 tps, lat 26.793 ms stddev 11.376
progress: 360.0 s, 36828.8 tps, lat 27.155 ms stddev 11.318
progress: 420.0 s, 36670.7 tps, lat 27.268 ms stddev 12.083
progress: 480.0 s, 37176.1 tps, lat 26.899 ms stddev 10.981
progress: 540.0 s, 37210.8 tps, lat 26.875 ms stddev 11.341
progress: 600.0 s, 37415.4 tps, lat 26.727 ms stddev 11.521
transaction type: <builtin: TPC-B (sort of)>
scaling factor: 10000
query mode: prepared
number of clients: 1000
number of threads: 1000
duration: 600 s
number of transactions actually processed: 22040445
latency average = 27.149 ms
latency stddev = 11.617 ms
tps = 36710.828624 (including connections establishing)
tps = 36811.054851 (excluding connections establishing)
- sysbenchテストを準備します:
sysbench --test=/usr/local/share/sysbench/oltp.lua \
    --pgsql-host=aurora.cluster-ctfirtyhadgr.us-east-1.rds.amazonaws.com \
    --pgsql-db=postgres \
    --pgsql-user=postgres \
    --pgsql-password=postgres \
    --pgsql-port=5432 \
    --oltp-tables-count=250\
    --oltp-table-size=450000 \
    prepare
出力:sysbench 0.5: multi-threaded system evaluation benchmark
Creating table 'sbtest1'...
Inserting 450000 records into 'sbtest1'
Creating secondary indexes on 'sbtest1'...
Creating table 'sbtest2'...
...
Creating table 'sbtest250'...
Inserting 450000 records into 'sbtest250'
Creating secondary indexes on 'sbtest250'...
- sysbenchテストを実行します:
sysbench --test=/usr/local/share/sysbench/oltp.lua \
    --pgsql-host=aurora.cluster-ctfirtyhadgr.us-east-1.rds.amazonaws.com \
    --pgsql-db=postgres \
    --pgsql-user=postgres \
    --pgsql-password=postgres \
    --pgsql-port=5432 \
    --oltp-tables-count=250 \
    --oltp-table-size=450000 \
    --max-requests=0 \
    --forced-shutdown \
    --report-interval=60 \
    --oltp_simple_ranges=0 \
    --oltp-distinct-ranges=0 \
    --oltp-sum-ranges=0 \
    --oltp-order-ranges=0 \
    --oltp-point-selects=0 \
    --rand-type=uniform \
    --max-time=600 \
    --num-threads=1000 \
    run
出力:sysbench 0.5: multi-threaded system evaluation benchmark
Running the test with following options:
Number of threads: 1000
Report intermediate results every 60 second(s)
Random number generator seed is 0 and will be ignored
Forcing shutdown in 630 seconds
Initializing worker threads...
Threads started!
[ 60s] threads: 1000, tps: 20443.09, reads: 0.00, writes: 81834.16, response time: 68.24ms (95%), errors: 0.62, reconnects: 0.00
[ 120s] threads: 1000, tps: 20580.68, reads: 0.00, writes: 82324.33, response time: 70.75ms (95%), errors: 0.73, reconnects: 0.00
[ 180s] threads: 1000, tps: 20531.85, reads: 0.00, writes: 82127.21, response time: 70.63ms (95%), errors: 0.73, reconnects: 0.00
[ 240s] threads: 1000, tps: 20212.67, reads: 0.00, writes: 80861.67, response time: 71.99ms (95%), errors: 0.43, reconnects: 0.00
[ 300s] threads: 1000, tps: 19383.90, reads: 0.00, writes: 77537.87, response time: 75.64ms (95%), errors: 0.75, reconnects: 0.00
[ 360s] threads: 1000, tps: 19797.20, reads: 0.00, writes: 79190.78, response time: 75.27ms (95%), errors: 0.68, reconnects: 0.00
[ 420s] threads: 1000, tps: 20304.43, reads: 0.00, writes: 81212.87, response time: 73.82ms (95%), errors: 0.70, reconnects: 0.00
[ 480s] threads: 1000, tps: 20933.80, reads: 0.00, writes: 83737.16, response time: 74.71ms (95%), errors: 0.68, reconnects: 0.00
[ 540s] threads: 1000, tps: 20663.05, reads: 0.00, writes: 82626.42, response time: 73.56ms (95%), errors: 0.75, reconnects: 0.00
[ 600s] threads: 1000, tps: 20746.02, reads: 0.00, writes: 83015.81, response time: 73.58ms (95%), errors: 0.78, reconnects: 0.00
OLTP test statistics:
queries performed:
read: 0
write: 48868458
other: 24434022
total: 73302480
transactions: 12216804 (20359.59 per sec.)
read/write requests: 48868458 (81440.43 per sec.)
other operations: 24434022 (40719.87 per sec.)
ignored errors: 414 (0.69 per sec.)
reconnects: 0 (0.00 per sec.)
General statistics:
total time: 600.0516s
total number of events: 12216804
total time taken by event execution: 599964.4735s
response time:
min: 6.27ms
avg: 49.11ms
max: 350.24ms
approx. 95 percentile: 72.90ms
Threads fairness:
events (avg/stddev): 12216.8040/31.27
execution time (avg/stddev): 599.9645/0.01
収集された指標
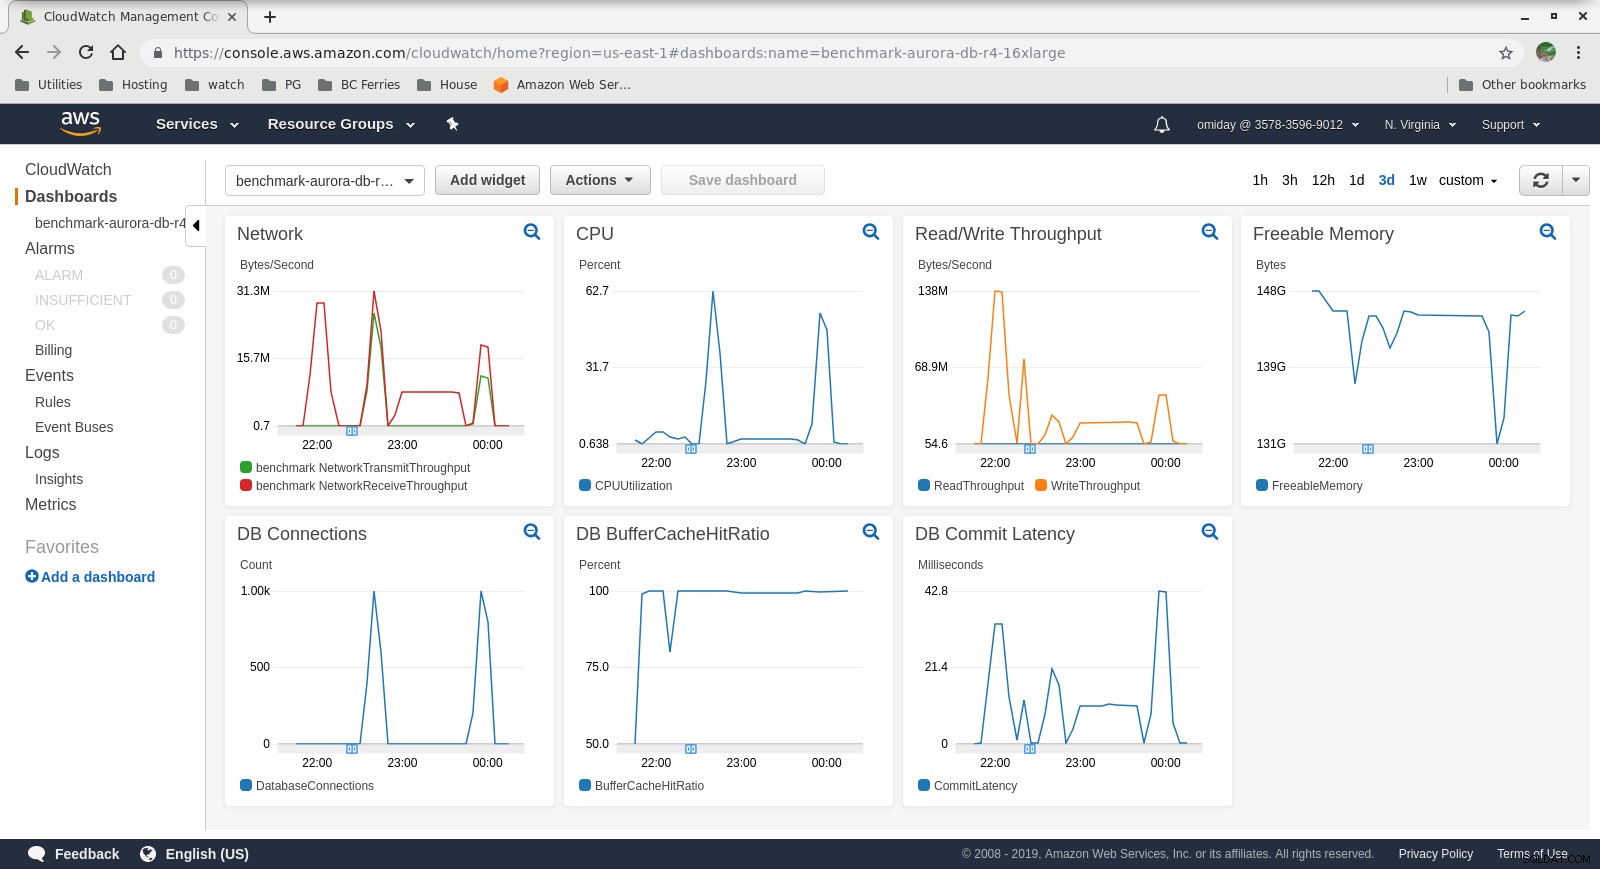 Cloudwatchメトリクス
 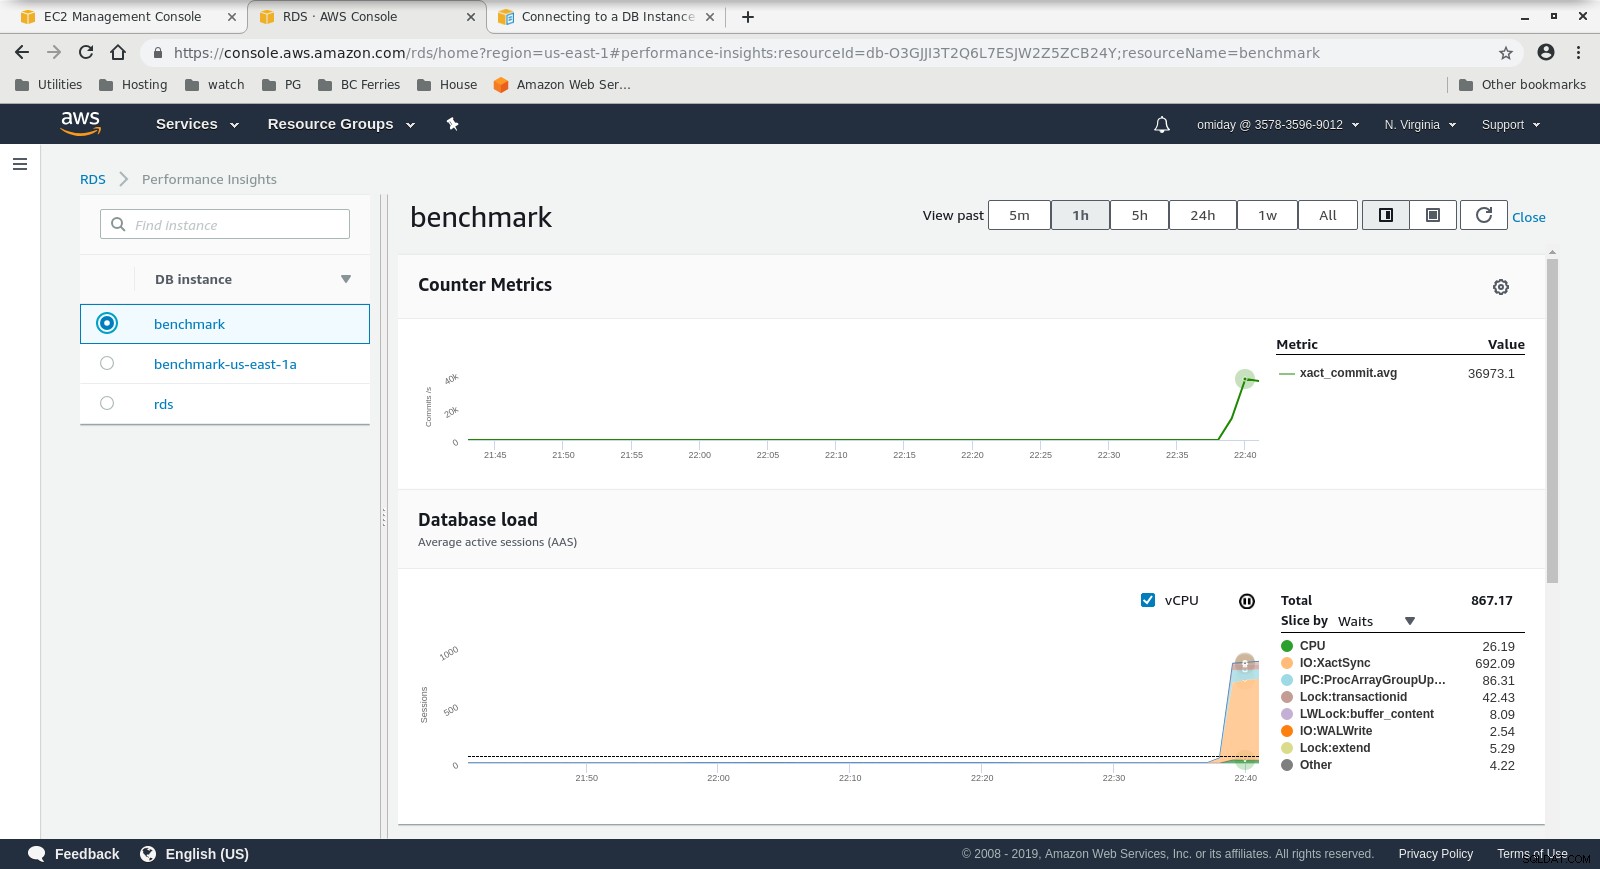 Performance Insightsメトリクス今日のホワイトペーパーをダウンロードClusterControlを使用したPostgreSQLの管理と自動化デプロイ、監視、 PostgreSQLの管理とスケーリングホワイトペーパーをダウンロード
 実行#2
詳細 - このテストでは、クライアントにAWS仕様を使用し、データベースに小さいインスタンスサイズを使用します。
- クライアントマシン:オンデマンドメモリ最適化EC2インスタンス:
- vCPU:32(16コアx 2スレッド/コア)
- RAM:244 GiB
- ストレージ:EBS最適化
- ネットワーク:10ギガビット
- DBクラスター:db.r4.2xlarge:
- vCPU:8
- RAM:61GiB
- ストレージ:EBS最適化
- ネットワーク:最大10Gbps接続で最大帯域幅1,750Mbps
- データベースにレプリカが含まれていませんでした。
- データベースストレージは暗号化されていません。
テストと結果の実行
- クライアントマシン:オンデマンドメモリ最適化EC2インスタンス:
- vCPU:32(16コアx 2スレッド/コア)
- RAM:244 GiB
- ストレージ:EBS最適化
- ネットワーク:10ギガビット
- DBクラスター:db.r4.16xlarge
- vCPU:64
- ECU(CPU容量):195 x [1.0-1.2 GHz] 2007 Opteron / Xeon
- RAM:488 GiB
- ストレージ:EBS最適化(I / O専用容量)
- ネットワーク:25Gpsネットワークで最大帯域幅14,000Mbps
export PGHOST=aurora.cluster-ctfirtyhadgr.us-east-1.rds.amazonaws.com
export PGUSER=postgres
export PGPASSWORD=postgres
export PGDATABASE=postgres
export PATH=$PATH:/usr/local/pgsql/bin
export LD_LIBRARY_PATH=$LD_LIBRARY_PATH:/usr/local/pgsql/lib[example@sqldat.com ~]# pgbench -i --fillfactor=90 --scale=10000
NOTICE: table "pgbench_history" does not exist, skipping
NOTICE: table "pgbench_tellers" does not exist, skipping
NOTICE: table "pgbench_accounts" does not exist, skipping
NOTICE: table "pgbench_branches" does not exist, skipping
creating tables...
100000 of 1000000000 tuples (0%) done (elapsed 0.05 s, remaining 457.23 s)
200000 of 1000000000 tuples (0%) done (elapsed 0.13 s, remaining 631.70 s)
300000 of 1000000000 tuples (0%) done (elapsed 0.21 s, remaining 688.29 s)
...
999500000 of 1000000000 tuples (99%) done (elapsed 811.41 s, remaining 0.41 s)
999600000 of 1000000000 tuples (99%) done (elapsed 811.50 s, remaining 0.32 s)
999700000 of 1000000000 tuples (99%) done (elapsed 811.58 s, remaining 0.24 s)
999800000 of 1000000000 tuples (99%) done (elapsed 811.65 s, remaining 0.16 s)
999900000 of 1000000000 tuples (99%) done (elapsed 811.73 s, remaining 0.08 s)
1000000000 of 1000000000 tuples (100%) done (elapsed 811.80 s, remaining 0.00 s)
vacuum...
set primary keys...
done.postgres=> \l+ postgres
List of databases
Name | Owner | Encoding | Collate | Ctype | Access privileges | Size | Tablespace | Description
----------+----------+----------+-------------+-------------+-------------------+--------+------------+--------------------------------------------
postgres | postgres | UTF8 | en_US.UTF-8 | en_US.UTF-8 | | 160 GB | pg_default | default administrative connection database
(1 row)SELECT
total_checkpoints,
seconds_since_start / total_checkpoints / 60 AS minutes_between_checkpoints FROM (
SELECT EXTRACT(
EPOCH FROM (
now() - pg_postmaster_start_time()
)
) AS seconds_since_start,
(checkpoints_timed+checkpoints_req) AS total_checkpoints
FROM pg_stat_bgwriter) AS sub;postgres=> \e
total_checkpoints | minutes_between_checkpoints
-------------------+-----------------------------
50 | 0.977392292333333
(1 row)[example@sqldat.com ~]# pgbench --protocol=prepared -P 60 --time=600 --client=1000 --jobs=2048starting vacuum...end.
progress: 60.0 s, 35670.3 tps, lat 27.243 ms stddev 10.915
progress: 120.0 s, 36569.5 tps, lat 27.352 ms stddev 11.859
progress: 180.0 s, 35845.2 tps, lat 27.896 ms stddev 12.785
progress: 240.0 s, 36613.7 tps, lat 27.310 ms stddev 11.804
progress: 300.0 s, 37323.4 tps, lat 26.793 ms stddev 11.376
progress: 360.0 s, 36828.8 tps, lat 27.155 ms stddev 11.318
progress: 420.0 s, 36670.7 tps, lat 27.268 ms stddev 12.083
progress: 480.0 s, 37176.1 tps, lat 26.899 ms stddev 10.981
progress: 540.0 s, 37210.8 tps, lat 26.875 ms stddev 11.341
progress: 600.0 s, 37415.4 tps, lat 26.727 ms stddev 11.521
transaction type: <builtin: TPC-B (sort of)>
scaling factor: 10000
query mode: prepared
number of clients: 1000
number of threads: 1000
duration: 600 s
number of transactions actually processed: 22040445
latency average = 27.149 ms
latency stddev = 11.617 ms
tps = 36710.828624 (including connections establishing)
tps = 36811.054851 (excluding connections establishing)sysbench --test=/usr/local/share/sysbench/oltp.lua \
--pgsql-host=aurora.cluster-ctfirtyhadgr.us-east-1.rds.amazonaws.com \
--pgsql-db=postgres \
--pgsql-user=postgres \
--pgsql-password=postgres \
--pgsql-port=5432 \
--oltp-tables-count=250\
--oltp-table-size=450000 \
preparesysbench 0.5: multi-threaded system evaluation benchmark
Creating table 'sbtest1'...
Inserting 450000 records into 'sbtest1'
Creating secondary indexes on 'sbtest1'...
Creating table 'sbtest2'...
...
Creating table 'sbtest250'...
Inserting 450000 records into 'sbtest250'
Creating secondary indexes on 'sbtest250'...sysbench --test=/usr/local/share/sysbench/oltp.lua \
--pgsql-host=aurora.cluster-ctfirtyhadgr.us-east-1.rds.amazonaws.com \
--pgsql-db=postgres \
--pgsql-user=postgres \
--pgsql-password=postgres \
--pgsql-port=5432 \
--oltp-tables-count=250 \
--oltp-table-size=450000 \
--max-requests=0 \
--forced-shutdown \
--report-interval=60 \
--oltp_simple_ranges=0 \
--oltp-distinct-ranges=0 \
--oltp-sum-ranges=0 \
--oltp-order-ranges=0 \
--oltp-point-selects=0 \
--rand-type=uniform \
--max-time=600 \
--num-threads=1000 \
runsysbench 0.5: multi-threaded system evaluation benchmark
Running the test with following options:
Number of threads: 1000
Report intermediate results every 60 second(s)
Random number generator seed is 0 and will be ignored
Forcing shutdown in 630 seconds
Initializing worker threads...
Threads started!
[ 60s] threads: 1000, tps: 20443.09, reads: 0.00, writes: 81834.16, response time: 68.24ms (95%), errors: 0.62, reconnects: 0.00
[ 120s] threads: 1000, tps: 20580.68, reads: 0.00, writes: 82324.33, response time: 70.75ms (95%), errors: 0.73, reconnects: 0.00
[ 180s] threads: 1000, tps: 20531.85, reads: 0.00, writes: 82127.21, response time: 70.63ms (95%), errors: 0.73, reconnects: 0.00
[ 240s] threads: 1000, tps: 20212.67, reads: 0.00, writes: 80861.67, response time: 71.99ms (95%), errors: 0.43, reconnects: 0.00
[ 300s] threads: 1000, tps: 19383.90, reads: 0.00, writes: 77537.87, response time: 75.64ms (95%), errors: 0.75, reconnects: 0.00
[ 360s] threads: 1000, tps: 19797.20, reads: 0.00, writes: 79190.78, response time: 75.27ms (95%), errors: 0.68, reconnects: 0.00
[ 420s] threads: 1000, tps: 20304.43, reads: 0.00, writes: 81212.87, response time: 73.82ms (95%), errors: 0.70, reconnects: 0.00
[ 480s] threads: 1000, tps: 20933.80, reads: 0.00, writes: 83737.16, response time: 74.71ms (95%), errors: 0.68, reconnects: 0.00
[ 540s] threads: 1000, tps: 20663.05, reads: 0.00, writes: 82626.42, response time: 73.56ms (95%), errors: 0.75, reconnects: 0.00
[ 600s] threads: 1000, tps: 20746.02, reads: 0.00, writes: 83015.81, response time: 73.58ms (95%), errors: 0.78, reconnects: 0.00
OLTP test statistics:
queries performed:
read: 0
write: 48868458
other: 24434022
total: 73302480
transactions: 12216804 (20359.59 per sec.)
read/write requests: 48868458 (81440.43 per sec.)
other operations: 24434022 (40719.87 per sec.)
ignored errors: 414 (0.69 per sec.)
reconnects: 0 (0.00 per sec.)
General statistics:
total time: 600.0516s
total number of events: 12216804
total time taken by event execution: 599964.4735s
response time:
min: 6.27ms
avg: 49.11ms
max: 350.24ms
approx. 95 percentile: 72.90ms
Threads fairness:
events (avg/stddev): 12216.8040/31.27
execution time (avg/stddev): 599.9645/0.01- このテストでは、クライアントにAWS仕様を使用し、データベースに小さいインスタンスサイズを使用します。
- クライアントマシン:オンデマンドメモリ最適化EC2インスタンス:
- vCPU:32(16コアx 2スレッド/コア)
- RAM:244 GiB
- ストレージ:EBS最適化
- ネットワーク:10ギガビット
- DBクラスター:db.r4.2xlarge:
- vCPU:8
- RAM:61GiB
- ストレージ:EBS最適化
- ネットワーク:最大10Gbps接続で最大帯域幅1,750Mbps
- クライアントマシン:オンデマンドメモリ最適化EC2インスタンス:
- データベースにレプリカが含まれていませんでした。
- データベースストレージは暗号化されていません。
テストと結果の実行
手順は実行#1と同じなので、出力のみを表示します:
-
pgbench読み取り/書き込みワークロード:
...

745700000 of 1000000000 tuples (74%) done (elapsed 794.93 s, remaining 271.09 s)
745800000 of 1000000000 tuples (74%) done (elapsed 795.00 s, remaining 270.97 s)
745900000 of 1000000000 tuples (74%) done (elapsed 795.09 s, remaining 270.86 s)
746000000 of 1000000000 tuples (74%) done (elapsed 795.17 s, remaining 270.74 s)
746100000 of 1000000000 tuples (74%) done (elapsed 795.24 s, remaining 270.62 s)
746200000 of 1000000000 tuples (74%) done (elapsed 795.33 s, remaining 270.51 s)

...

999800000 of 1000000000 tuples (99%) done (elapsed 1067.11 s, remaining 0.21 s)
999900000 of 1000000000 tuples (99%) done (elapsed 1067.19 s, remaining 0.11 s)
1000000000 of 1000000000 tuples (100%) done (elapsed 1067.28 s, remaining 0.00 s)
vacuum...
set primary keys...
total time: 4386.44 s (insert 1067.33 s, commit 0.46 s, vacuum 2088.25 s, index 1230.41 s)
done.
starting vacuum...end. progress: 60.0 s, 3361.3 tps, lat 286.143 ms stddev 80.417 progress: 120.0 s, 3466.8 tps, lat 288.386 ms stddev 76.373 progress: 180.0 s, 3683.1 tps, lat 271.840 ms stddev 75.712 progress: 240.0 s, 3444.3 tps, lat 289.909 ms stddev 69.564 progress: 300.0 s, 3475.8 tps, lat 287.736 ms stddev 73.712 progress: 360.0 s, 3449.5 tps, lat 289.832 ms stddev 71.878 progress: 420.0 s, 3518.1 tps, lat 284.432 ms stddev 74.276 progress: 480.0 s, 3430.7 tps, lat 291.359 ms stddev 73.264 progress: 540.0 s, 3515.7 tps, lat 284.522 ms stddev 73.206 progress: 600.0 s, 3482.9 tps, lat 287.037 ms stddev 71.649 transaction type: <builtin: TPC-B (sort of)> scaling factor: 10000 query mode: prepared number of clients: 1000 number of threads: 1000 duration: 600 s number of transactions actually processed: 2090702 latency average = 286.030 ms latency stddev = 74.245 ms tps = 3481.731730 (including connections establishing) tps = 3494.157830 (excluding connections establishing) -
sysbenchテスト:
sysbench 0.5:  multi-threaded system evaluation benchmark

Running the test with following options:
Number of threads: 1000
Report intermediate results every 60 second(s)
Random number generator seed is 0 and will be ignored

Forcing shutdown in 630 seconds

Initializing worker threads...

Threads started!

[  60s] threads: 1000, tps: 4809.05, reads: 0.00, writes: 19301.02, response time: 288.03ms (95%), errors: 0.05, reconnects:  0.00
[ 120s] threads: 1000, tps: 5264.15, reads: 0.00, writes: 21005.40, response time: 255.23ms (95%), errors: 0.08, reconnects:  0.00
[ 180s] threads: 1000, tps: 5178.27, reads: 0.00, writes: 20713.07, response time: 260.40ms (95%), errors: 0.03, reconnects:  0.00
[ 240s] threads: 1000, tps: 5145.95, reads: 0.00, writes: 20610.08, response time: 255.76ms (95%), errors: 0.05, reconnects:  0.00
[ 300s] threads: 1000, tps: 5127.92, reads: 0.00, writes: 20507.98, response time: 264.24ms (95%), errors: 0.05, reconnects:  0.00
[ 360s] threads: 1000, tps: 5063.83, reads: 0.00, writes: 20278.10, response time: 268.55ms (95%), errors: 0.05, reconnects:  0.00
[ 420s] threads: 1000, tps: 5057.51, reads: 0.00, writes: 20237.28, response time: 269.19ms (95%), errors: 0.10, reconnects:  0.00
[ 480s] threads: 1000, tps: 5036.32, reads: 0.00, writes: 20139.29, response time: 279.62ms (95%), errors: 0.10, reconnects:  0.00
[ 540s] threads: 1000, tps: 5115.25, reads: 0.00, writes: 20459.05, response time: 264.64ms (95%), errors: 0.08, reconnects:  0.00
[ 600s] threads: 1000, tps: 5124.89, reads: 0.00, writes: 20510.07, response time: 265.43ms (95%), errors: 0.10, reconnects:  0.00
OLTP test statistics:
    queries performed:
        read:                            0
        write:                           12225686
        other:                           6112822
        total:                           18338508
    transactions:                        3056390 (5093.75 per sec.)
    read/write requests:                 12225686 (20375.20 per sec.)
    other operations:                    6112822 (10187.57 per sec.)
    ignored errors:                      42     (0.07 per sec.)
    reconnects:                          0      (0.00 per sec.)

General statistics:
    total time:                          600.0277s
    total number of events:              3056390
    total time taken by event execution: 600005.2104s
    response time:
         min:                                  9.57ms
         avg:                                196.31ms
         max:                                608.70ms
         approx.  95 percentile:             268.71ms

Threads fairness:
    events (avg/stddev):           3056.3900/67.44
    execution time (avg/stddev):   600.0052/0.01
収集された指標
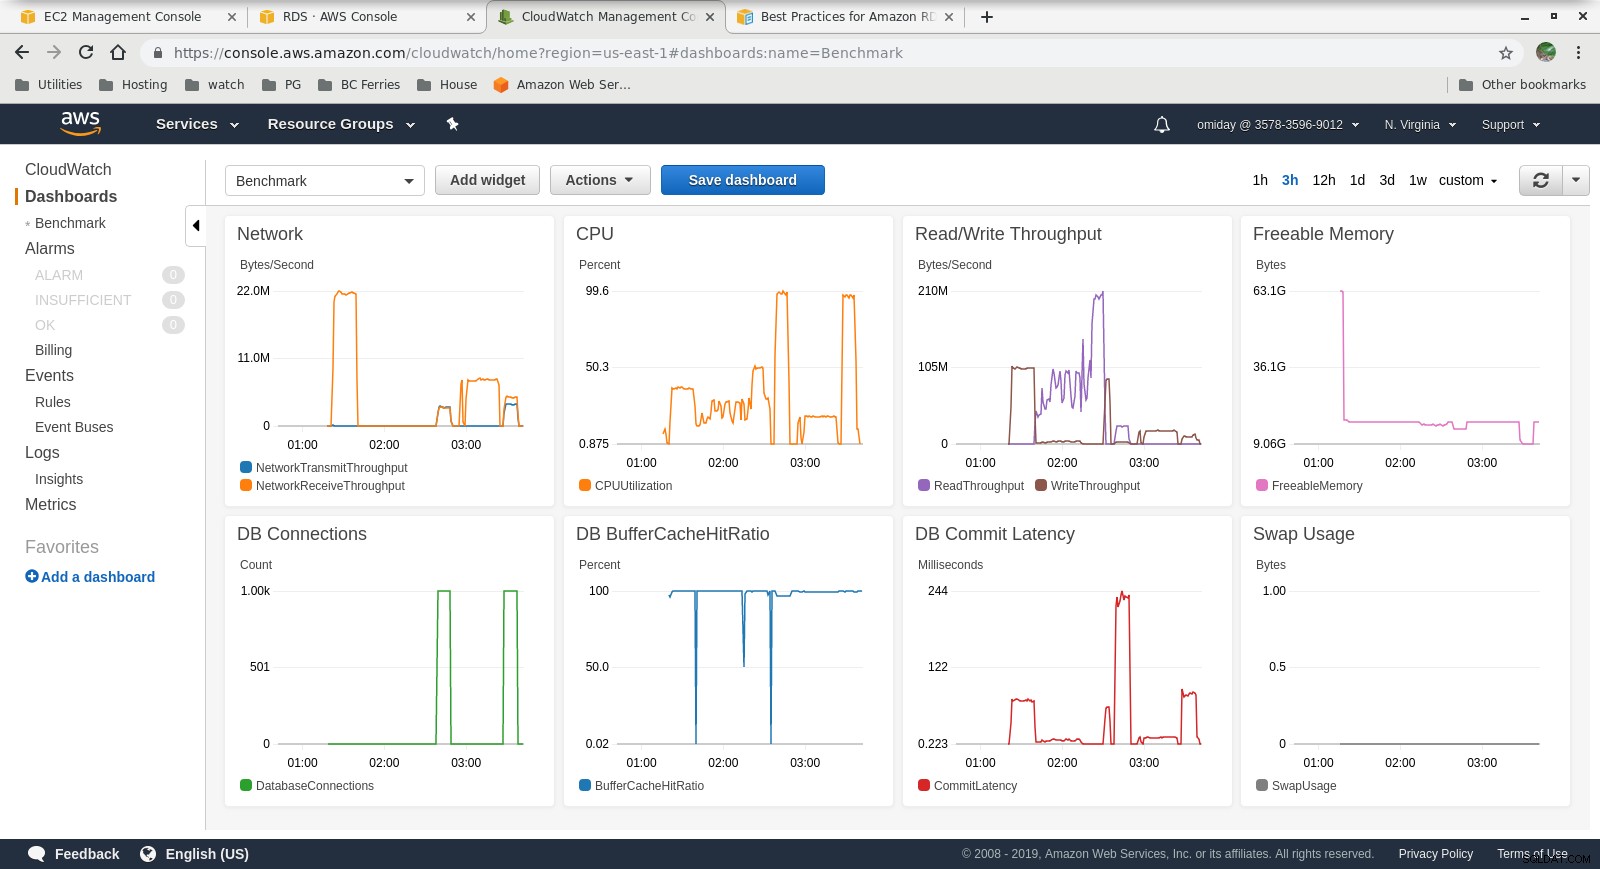 Cloudwatchメトリクス
 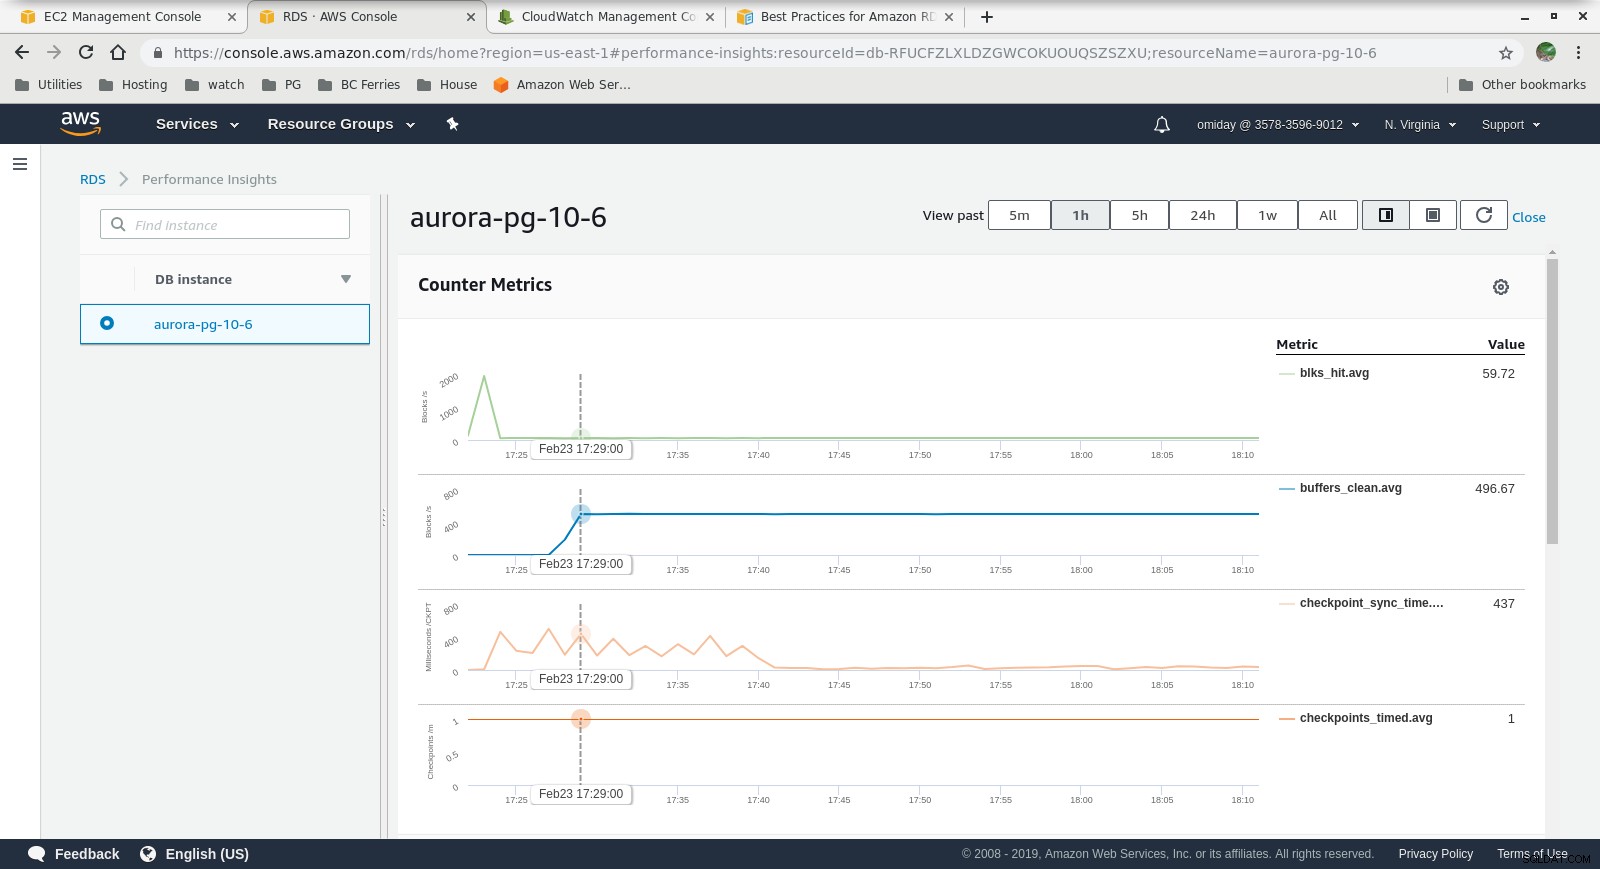 パフォーマンスインサイト-カウンターメトリクス
 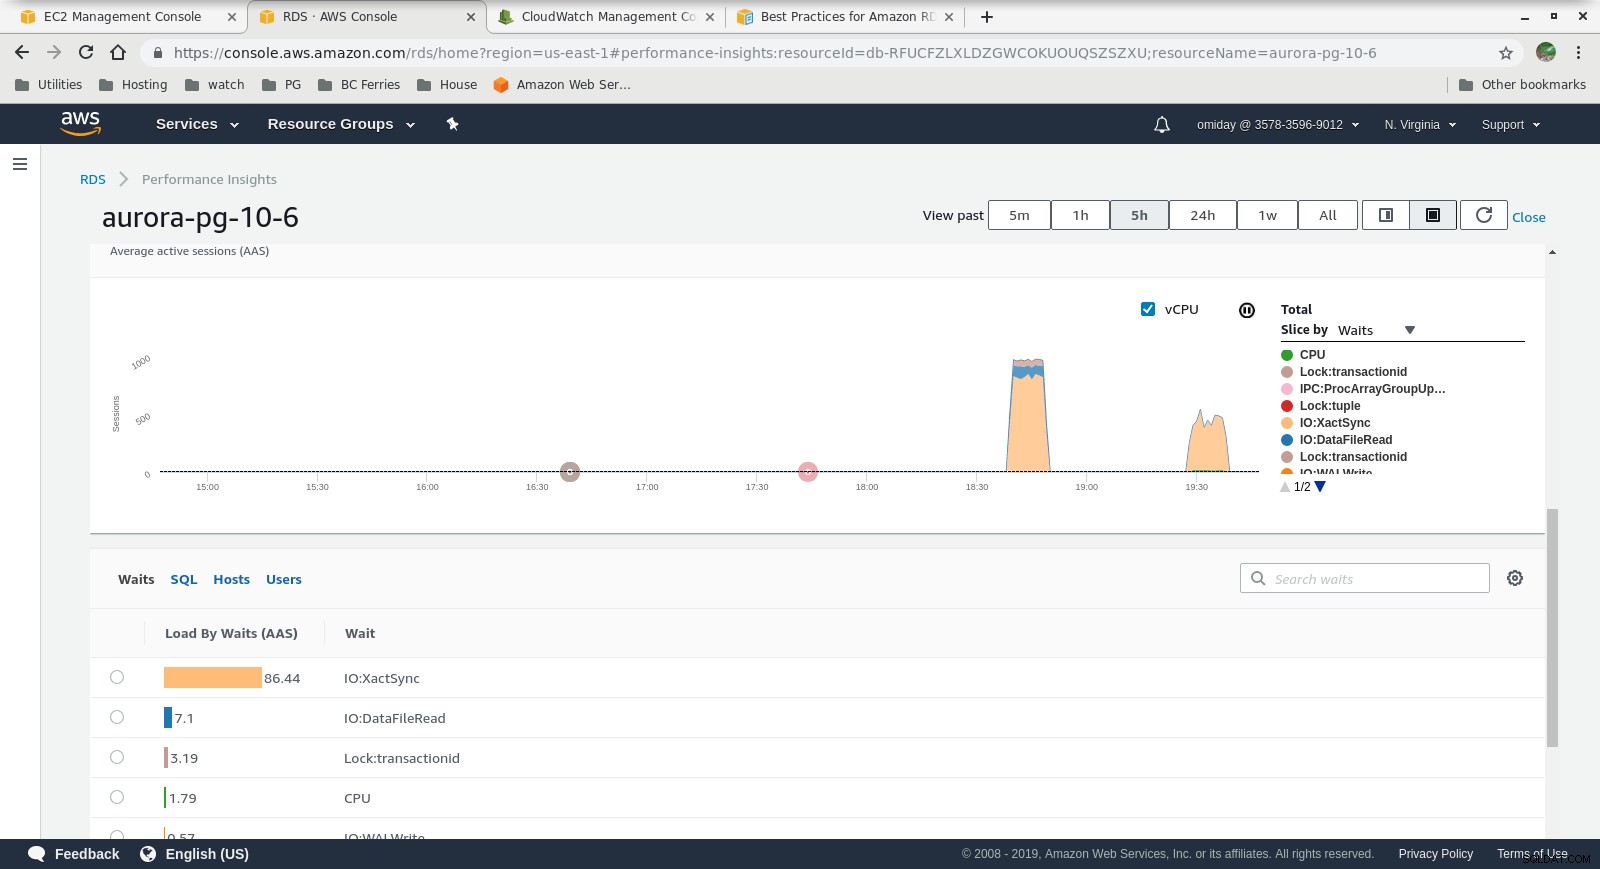 パフォーマンスインサイト-待機によるデータベースの読み込み
 最終的な考え
- ユーザーは、事前定義されたインスタンスサイズの使用に制限されています。欠点として、ベンチマークがインスタンスが追加のメモリの恩恵を受けることができることを示している場合、「RAMを追加するだけ」は不可能です。メモリを追加すると、インスタンスサイズが大きくなり、コストが高くなります(インスタンスサイズごとにコストが2倍になります)。
- Amazon AuroraストレージエンジンはRDSとは大きく異なり、SANハードウェア上に構築されています。インスタンスごとのI/Oスループットメトリックは、プロビジョニングされたIOPSSSDEBSボリュームの最大値である1,750MiB/sにテストがさらに近づかなかったことを示しています。
- PerformanceInsightsグラフに含まれているAWSPostgreSQLイベントを確認することで、さらに調整を行うことができます。
次のシリーズ
次のパート、PostgreSQL10.6用のAmazonRDSにご期待ください。